

Main project outputs, business planning documents, feedback reports and supporting materials prepared for MAPs ACE trainings.
The MAPs ACE Online Monitoring Network provides periodic weather and visual monitoring records from experimental fields and nearby reference locations in Kenya, Mauritius and South Africa.
The public online network combines weather-station data, selected visual records, short monitoring videos and downloadable weather microdata where available.
Developed as part of Deliverable D6.2 – On-line Monitoring Network. Due to local connectivity conditions, equipment installation periods and sensor operation, data availability and visual records may vary between locations and reporting periods.
Weather station IPRETO220 in Pretoria, South Africa.
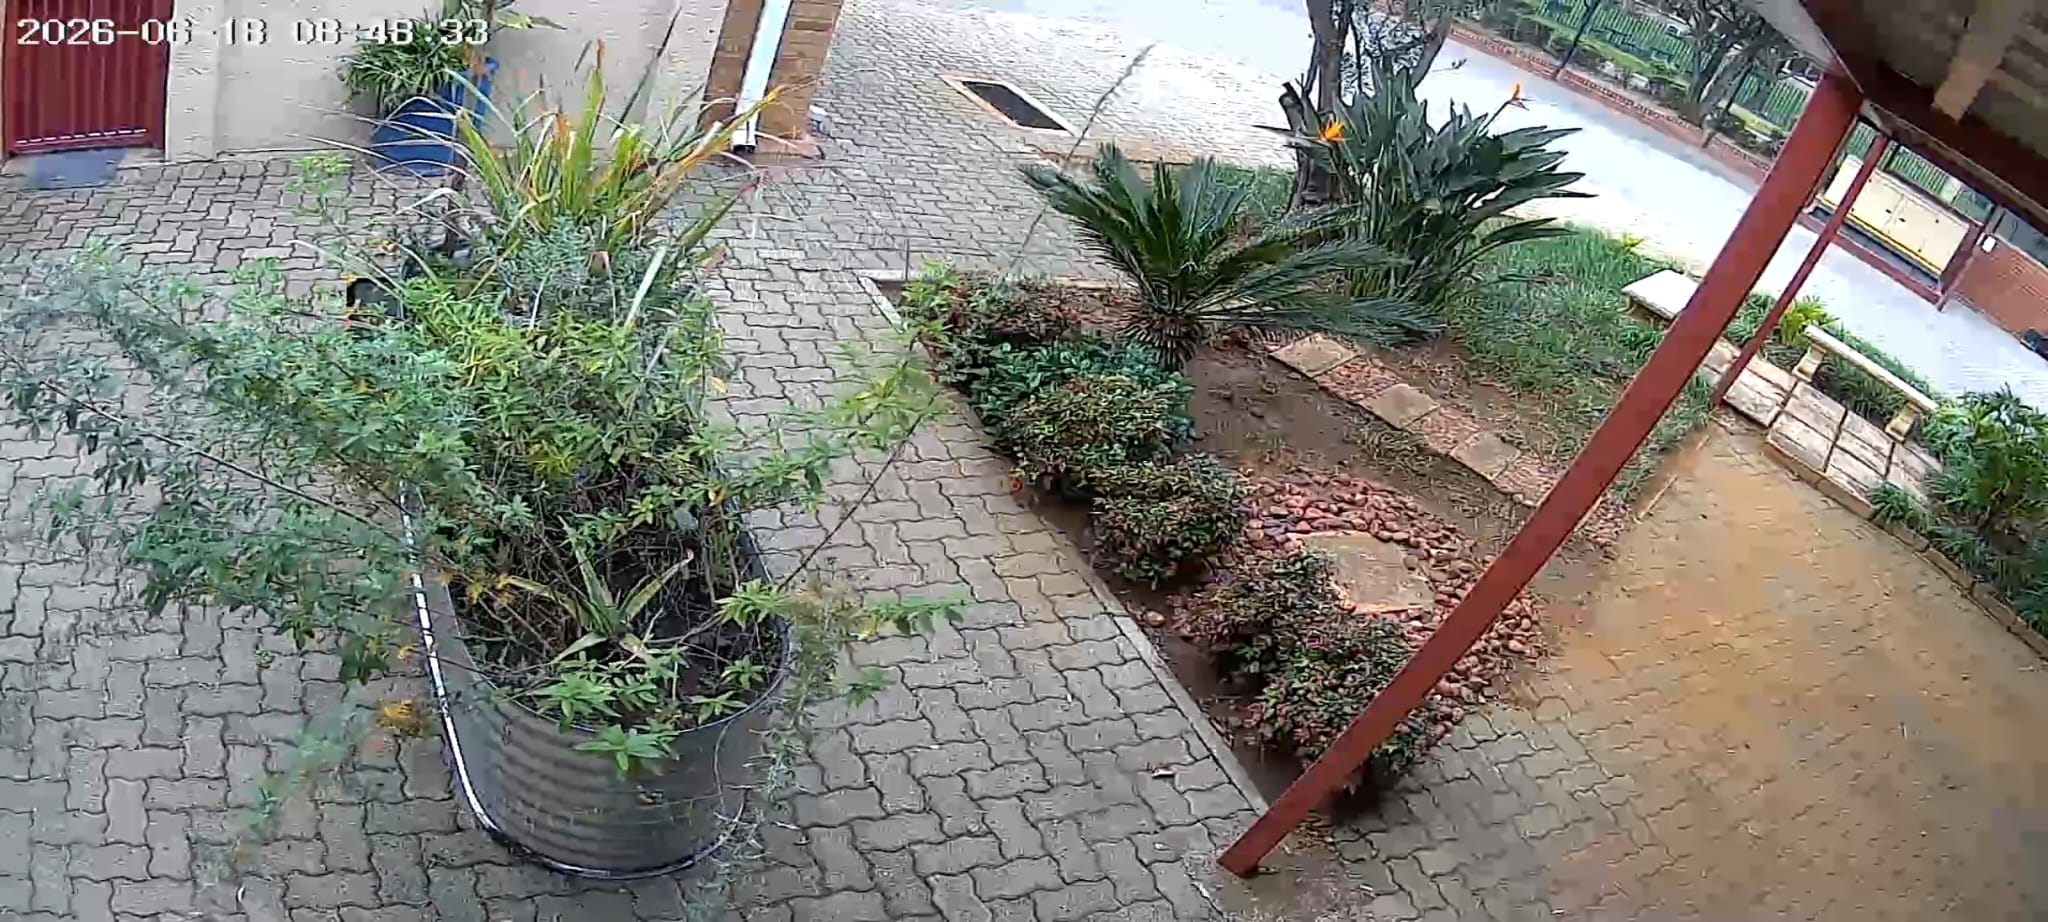
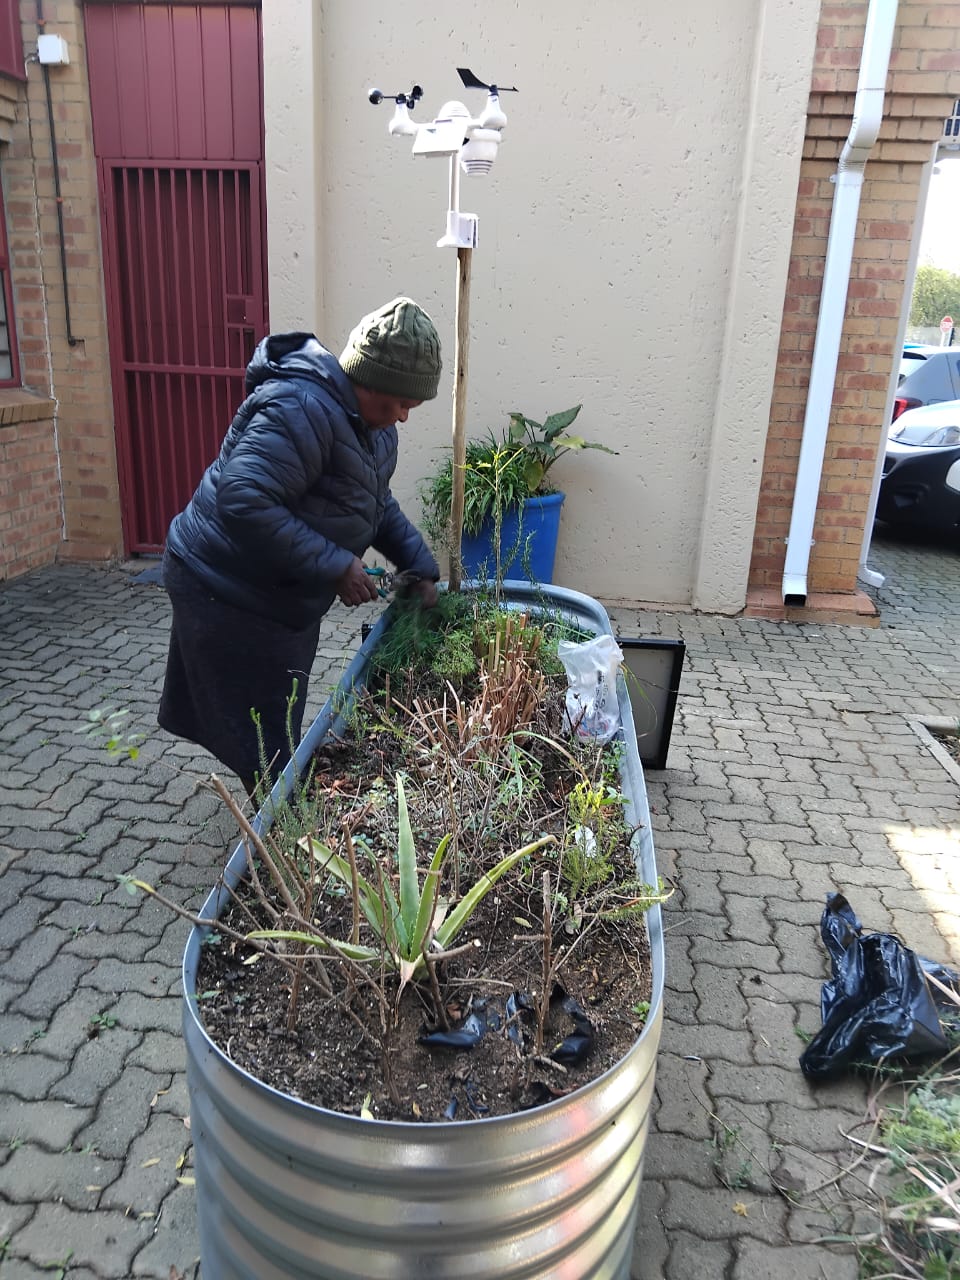
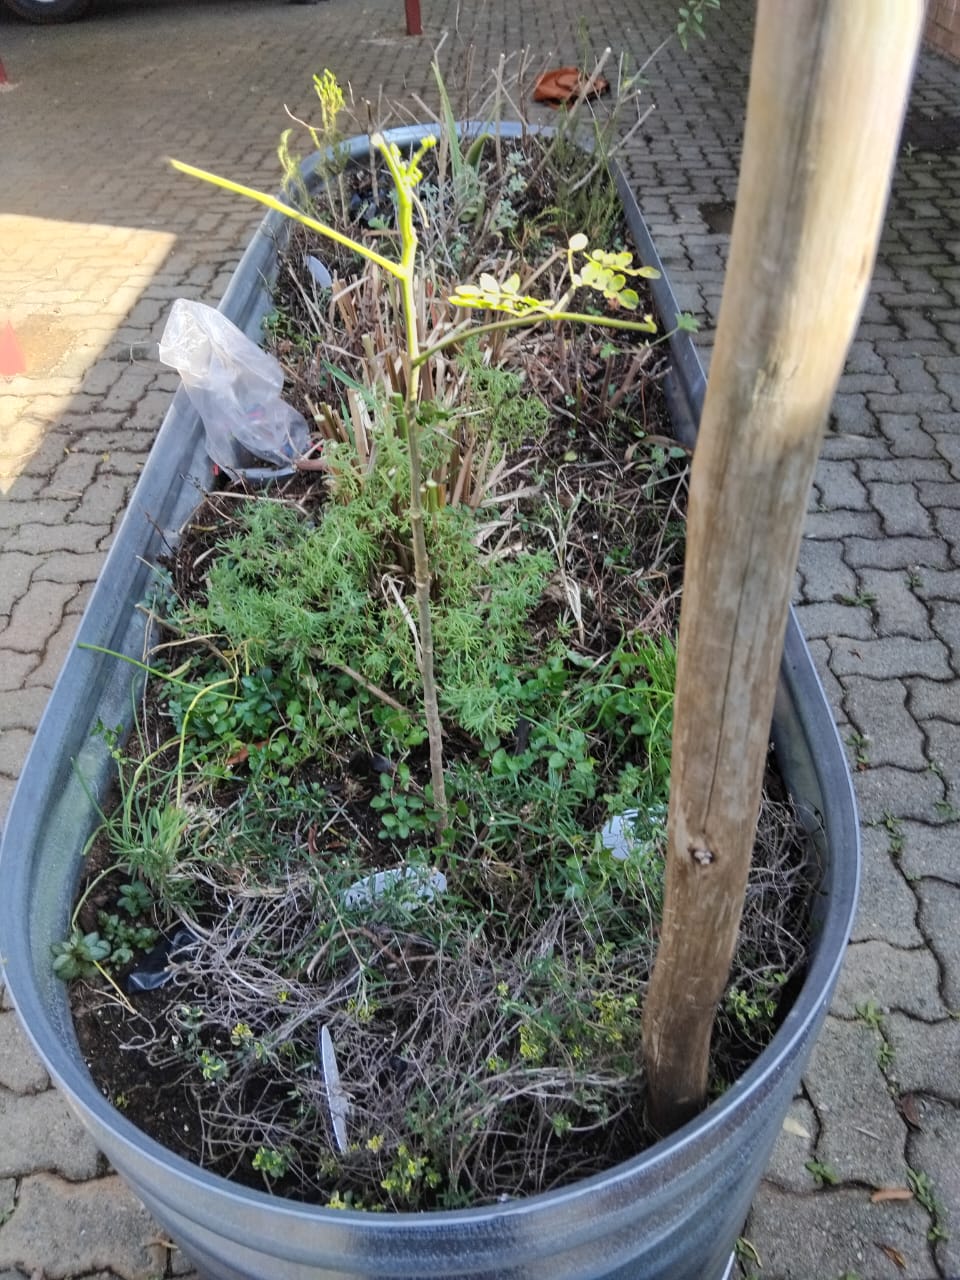
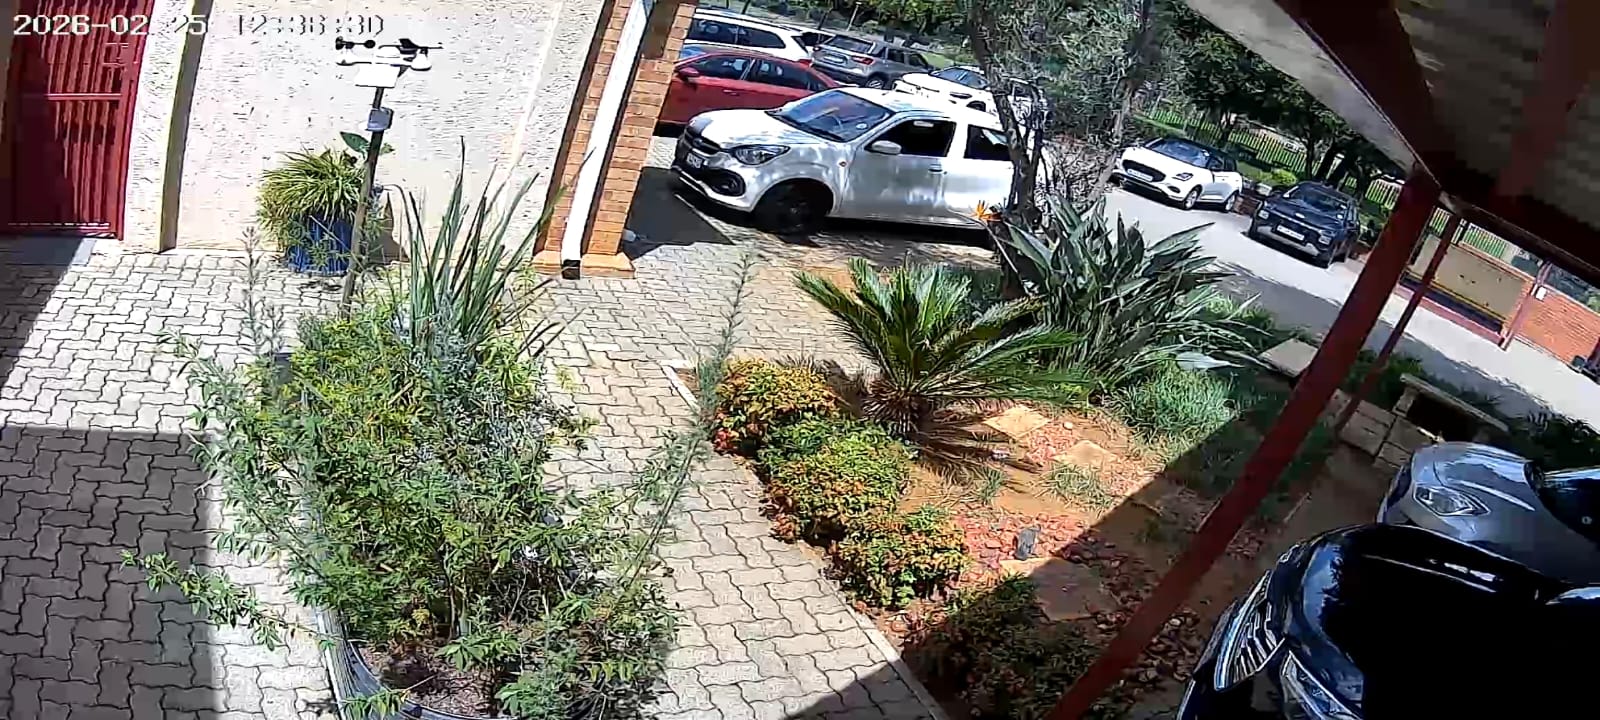
Monthly charts were prepared from daily weather-station records for the period November 2025 to June 2026. The Pretoria monitoring setup also includes selected visual records and short monitoring videos from the demonstration area.
Open full monitoring dashboard
Monthly charts are based on exported daily records from the IPRETO220 weather station monitoring system. They present daily high, average and low values where available.
Click any chart to open it in full size.
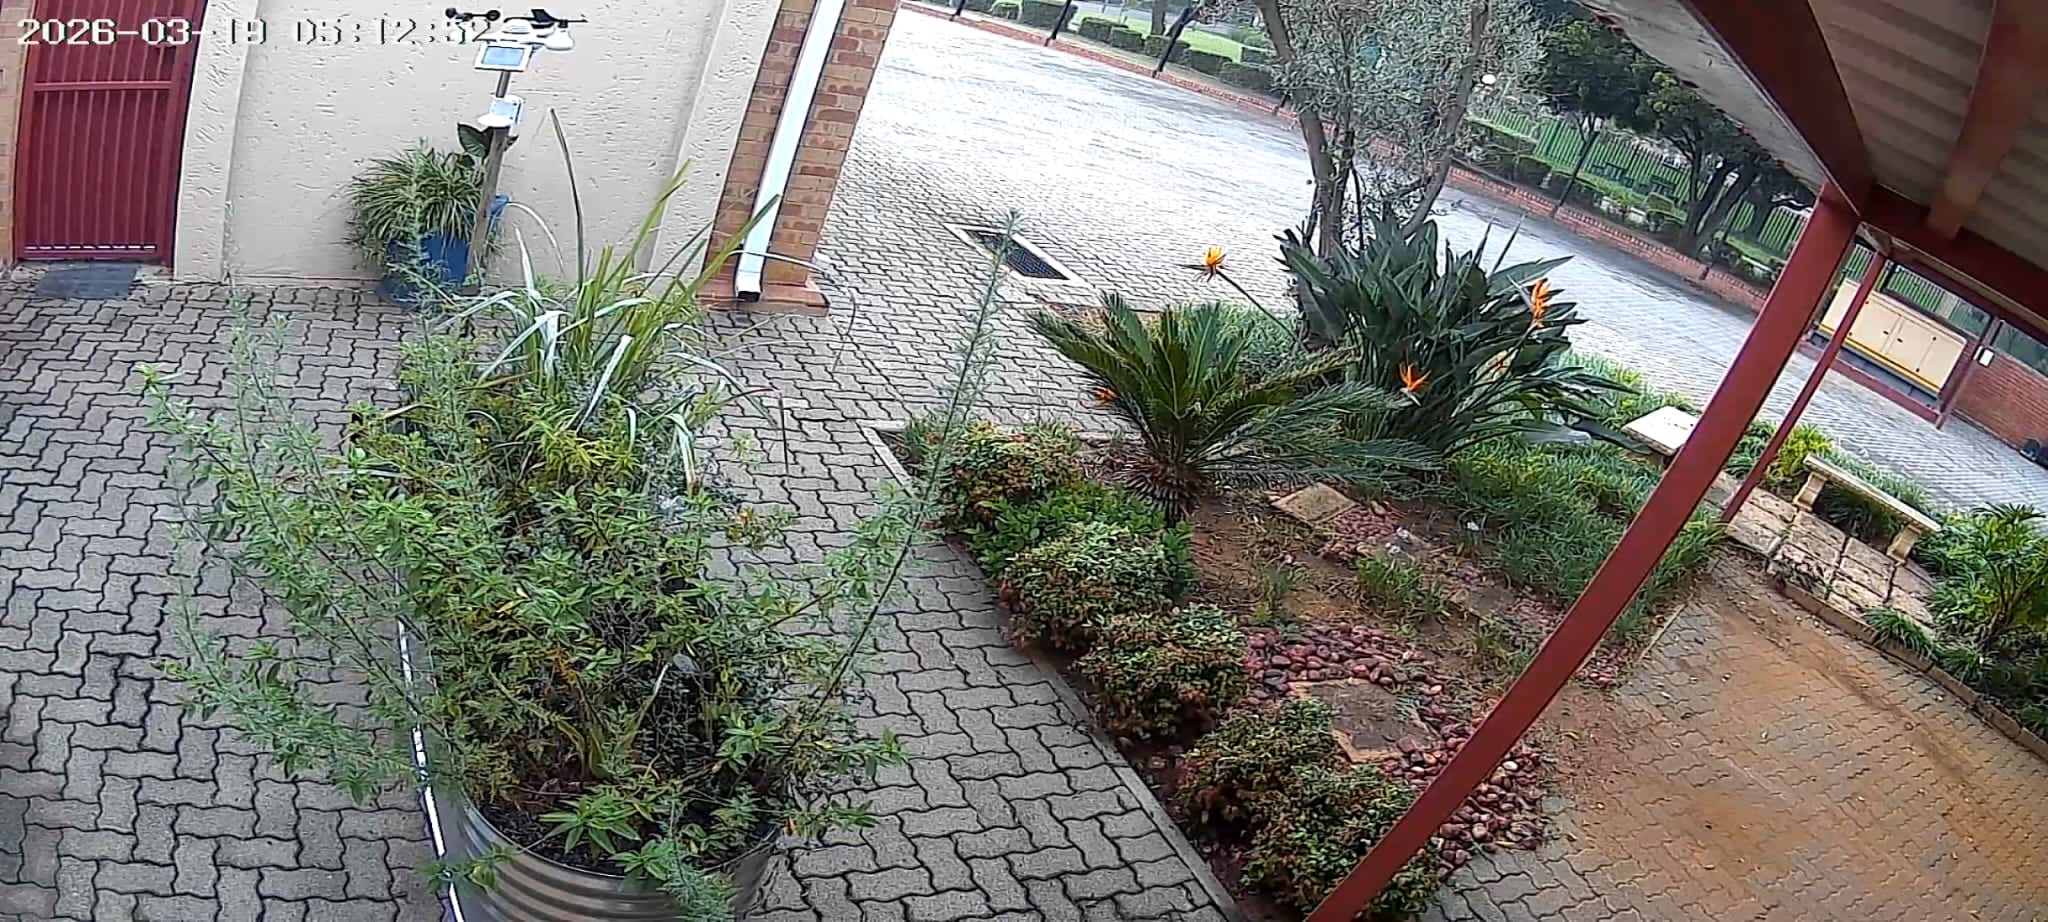
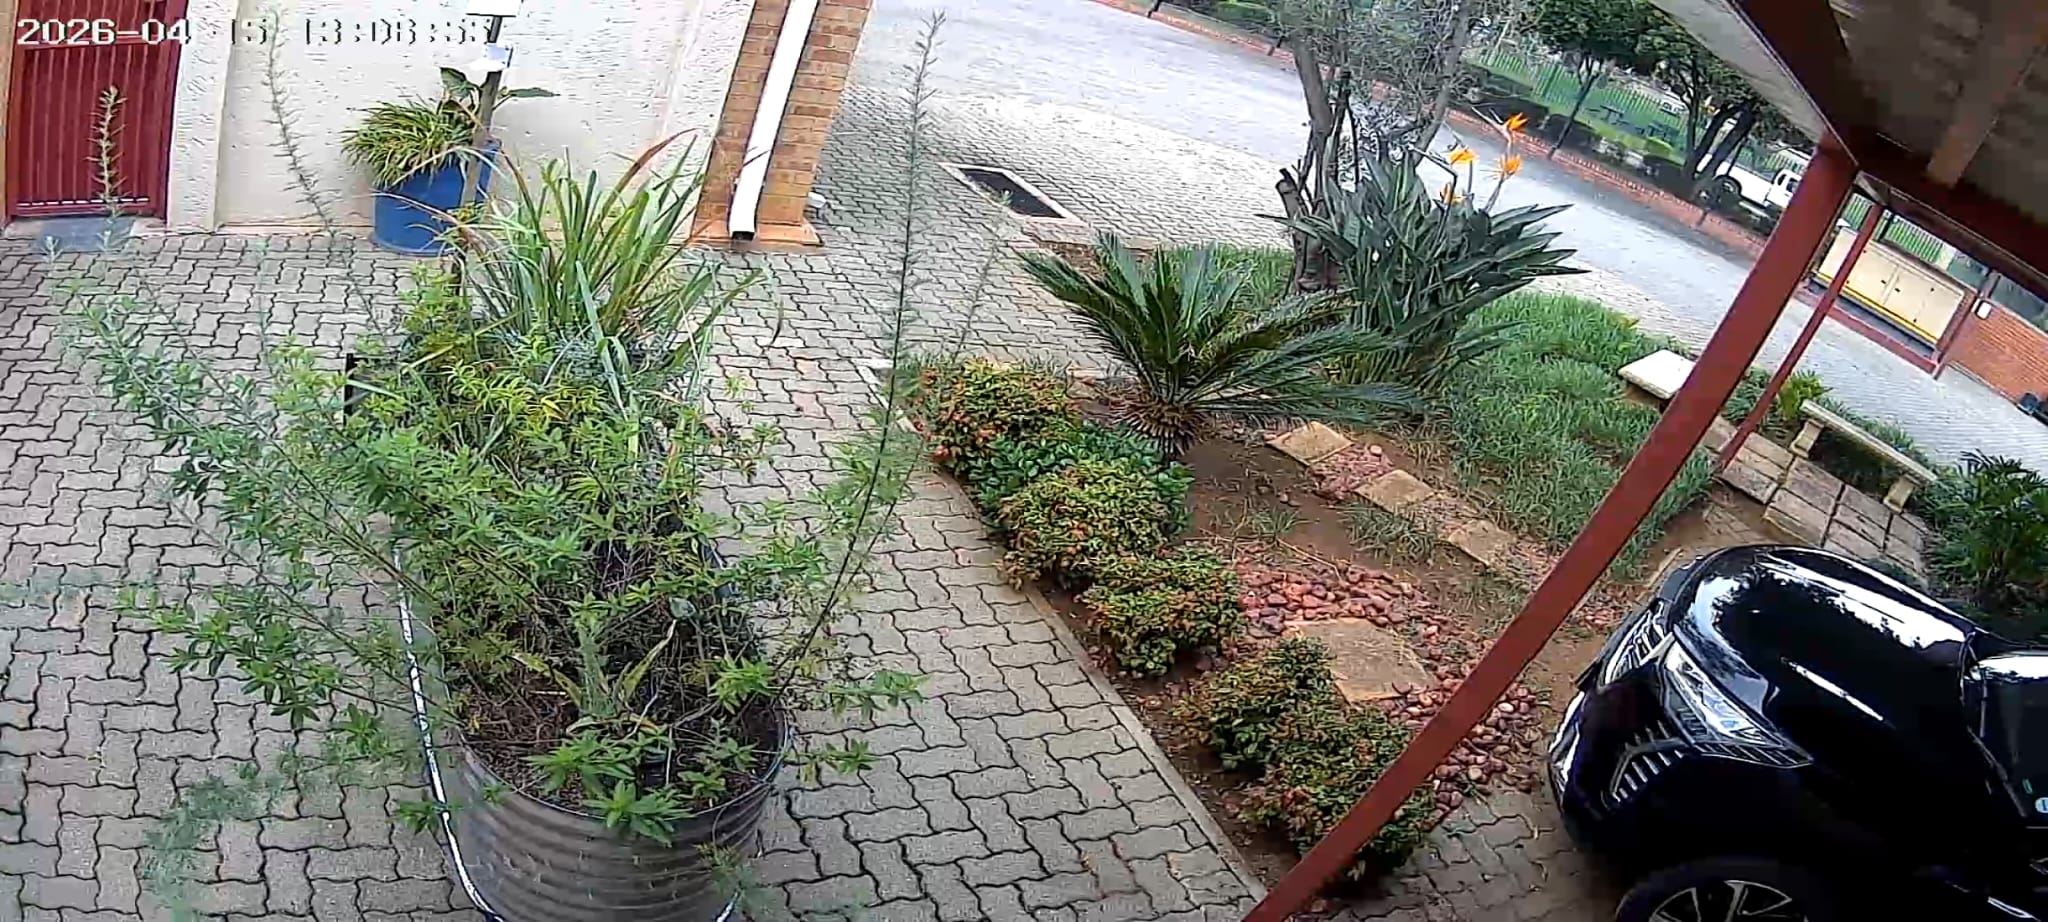
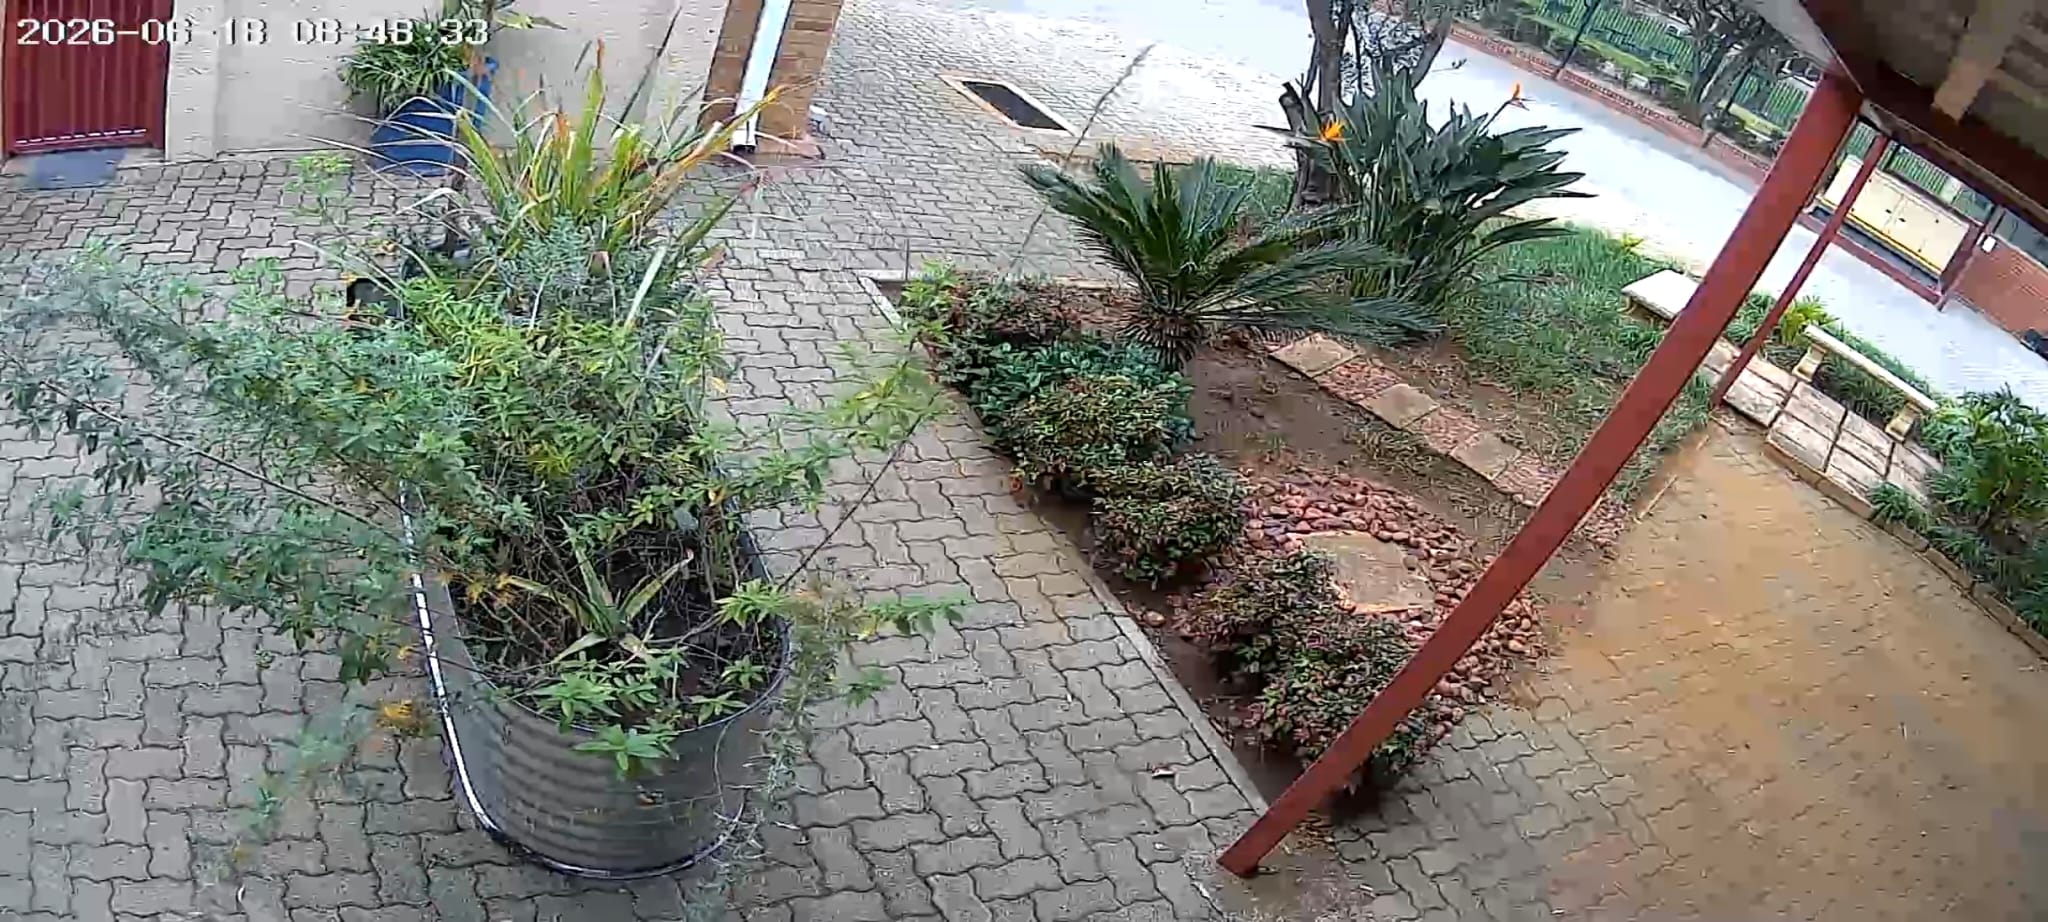
Selected visual records from the MAPs ACE demonstration area in Pretoria, showing monitored plants and the surrounding growing environment.
Downloadable files provide weather microdata and source workbooks for the South Africa monitoring location.
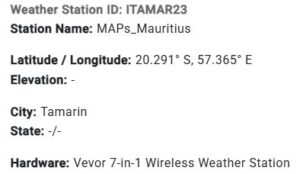
South Africa June 2026 XLSX South Africa June 2026 CSV IPRETO220 exported table IPRETO220 dataset workbookWeather station ITAMAR23 in Tamarin, Mauritius.
Weather monitoring records from the ITAMAR23 station are presented for the period in which the station was connected and transmitting data. Additional local reference data from the nearby ITAMAR18 station are used to provide monitoring context for the same area.
Open full monitoring dashboard
Selected available weather charts are based on project-station records and nearby local reference records from Tamarin.
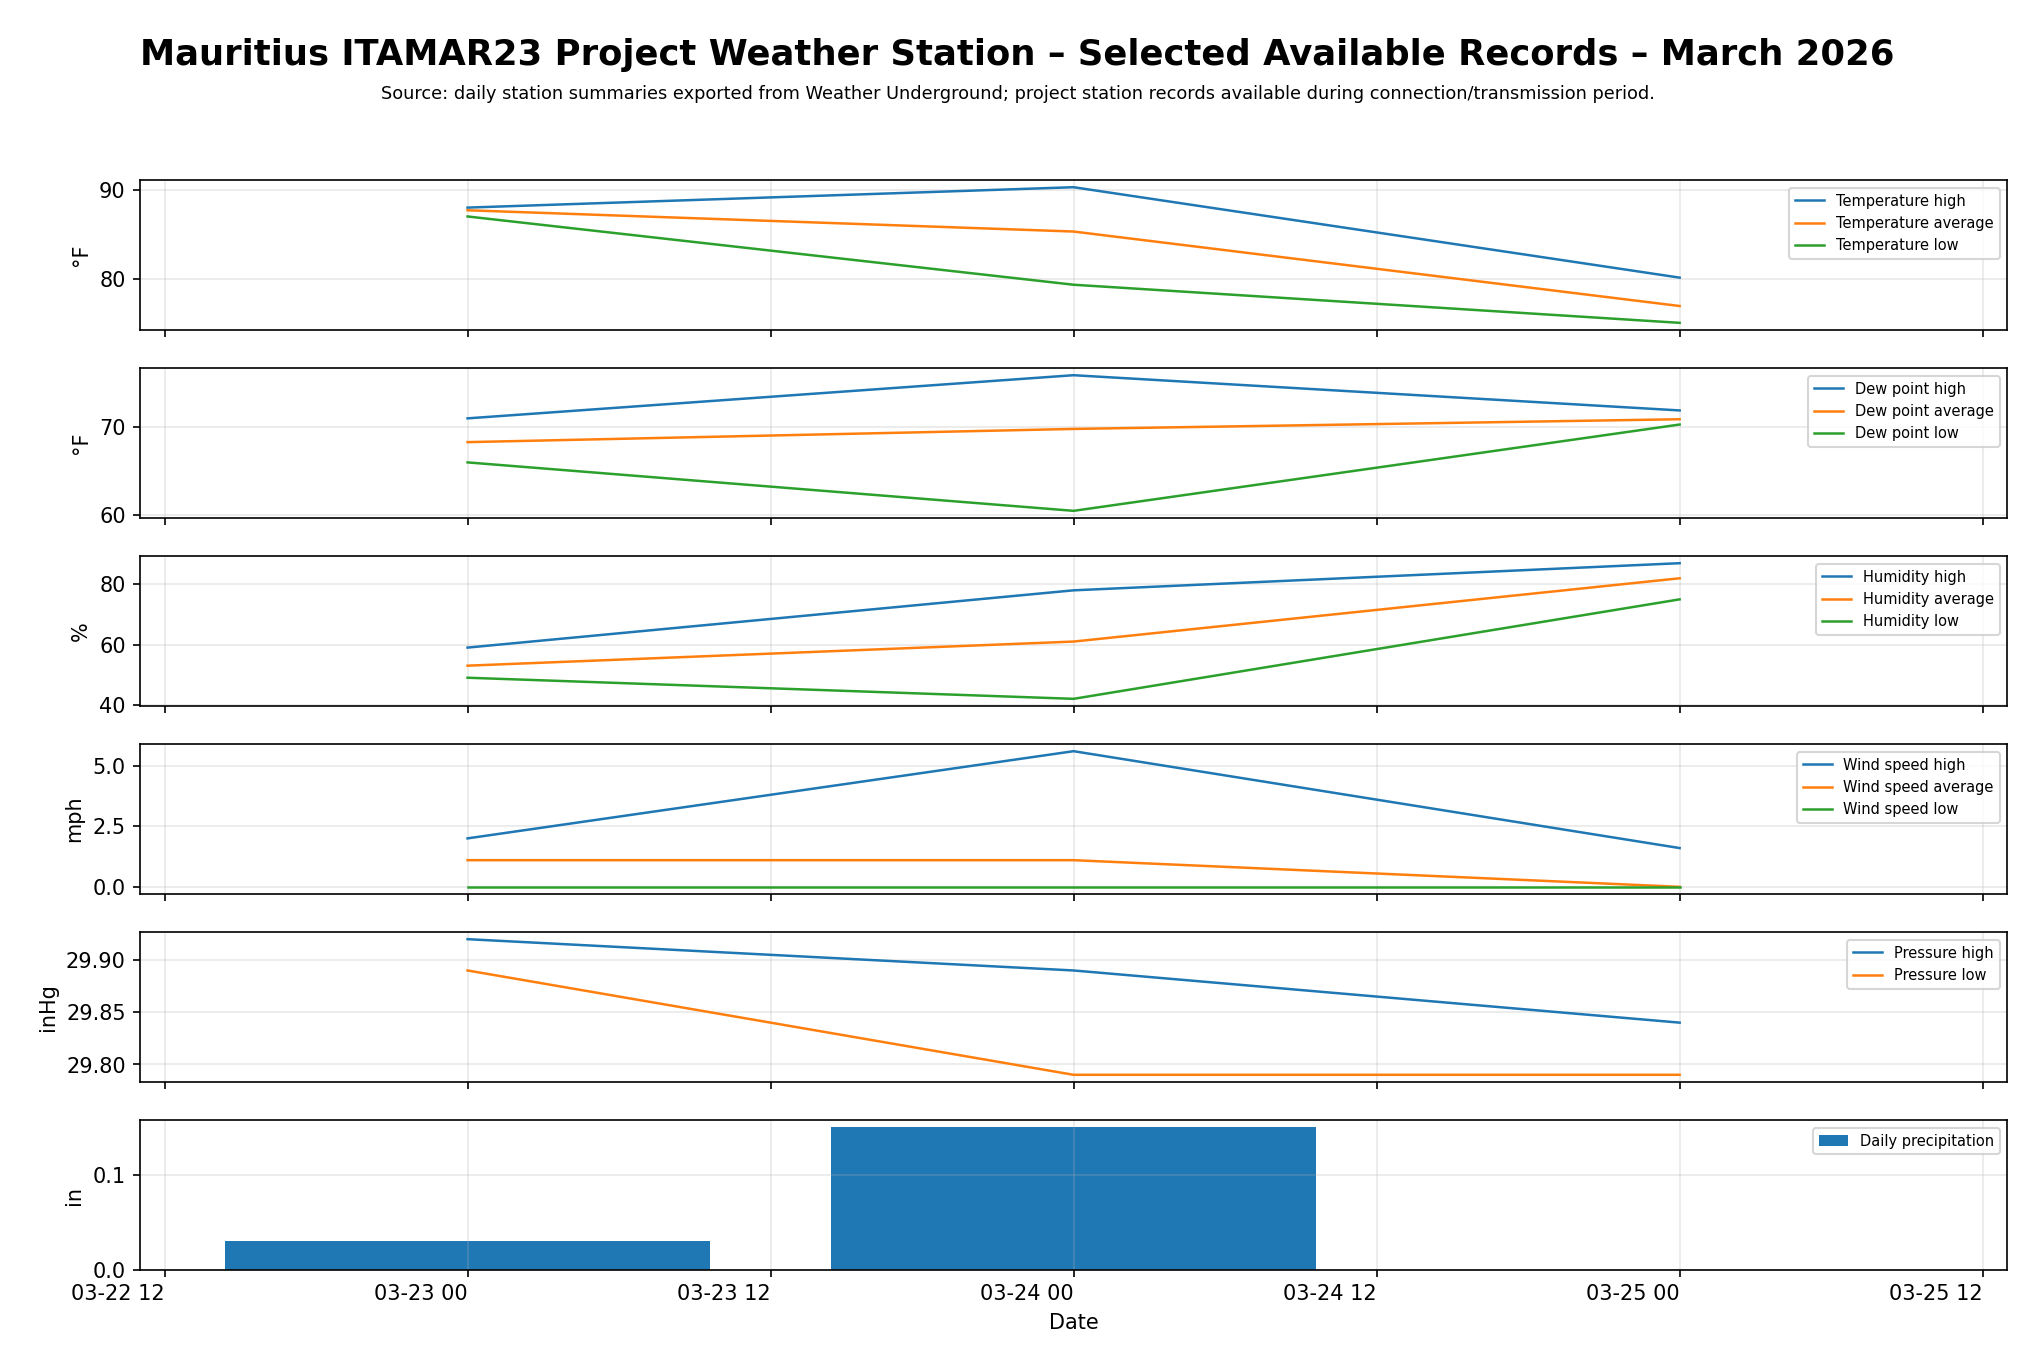 ITAMAR23 – March 2026
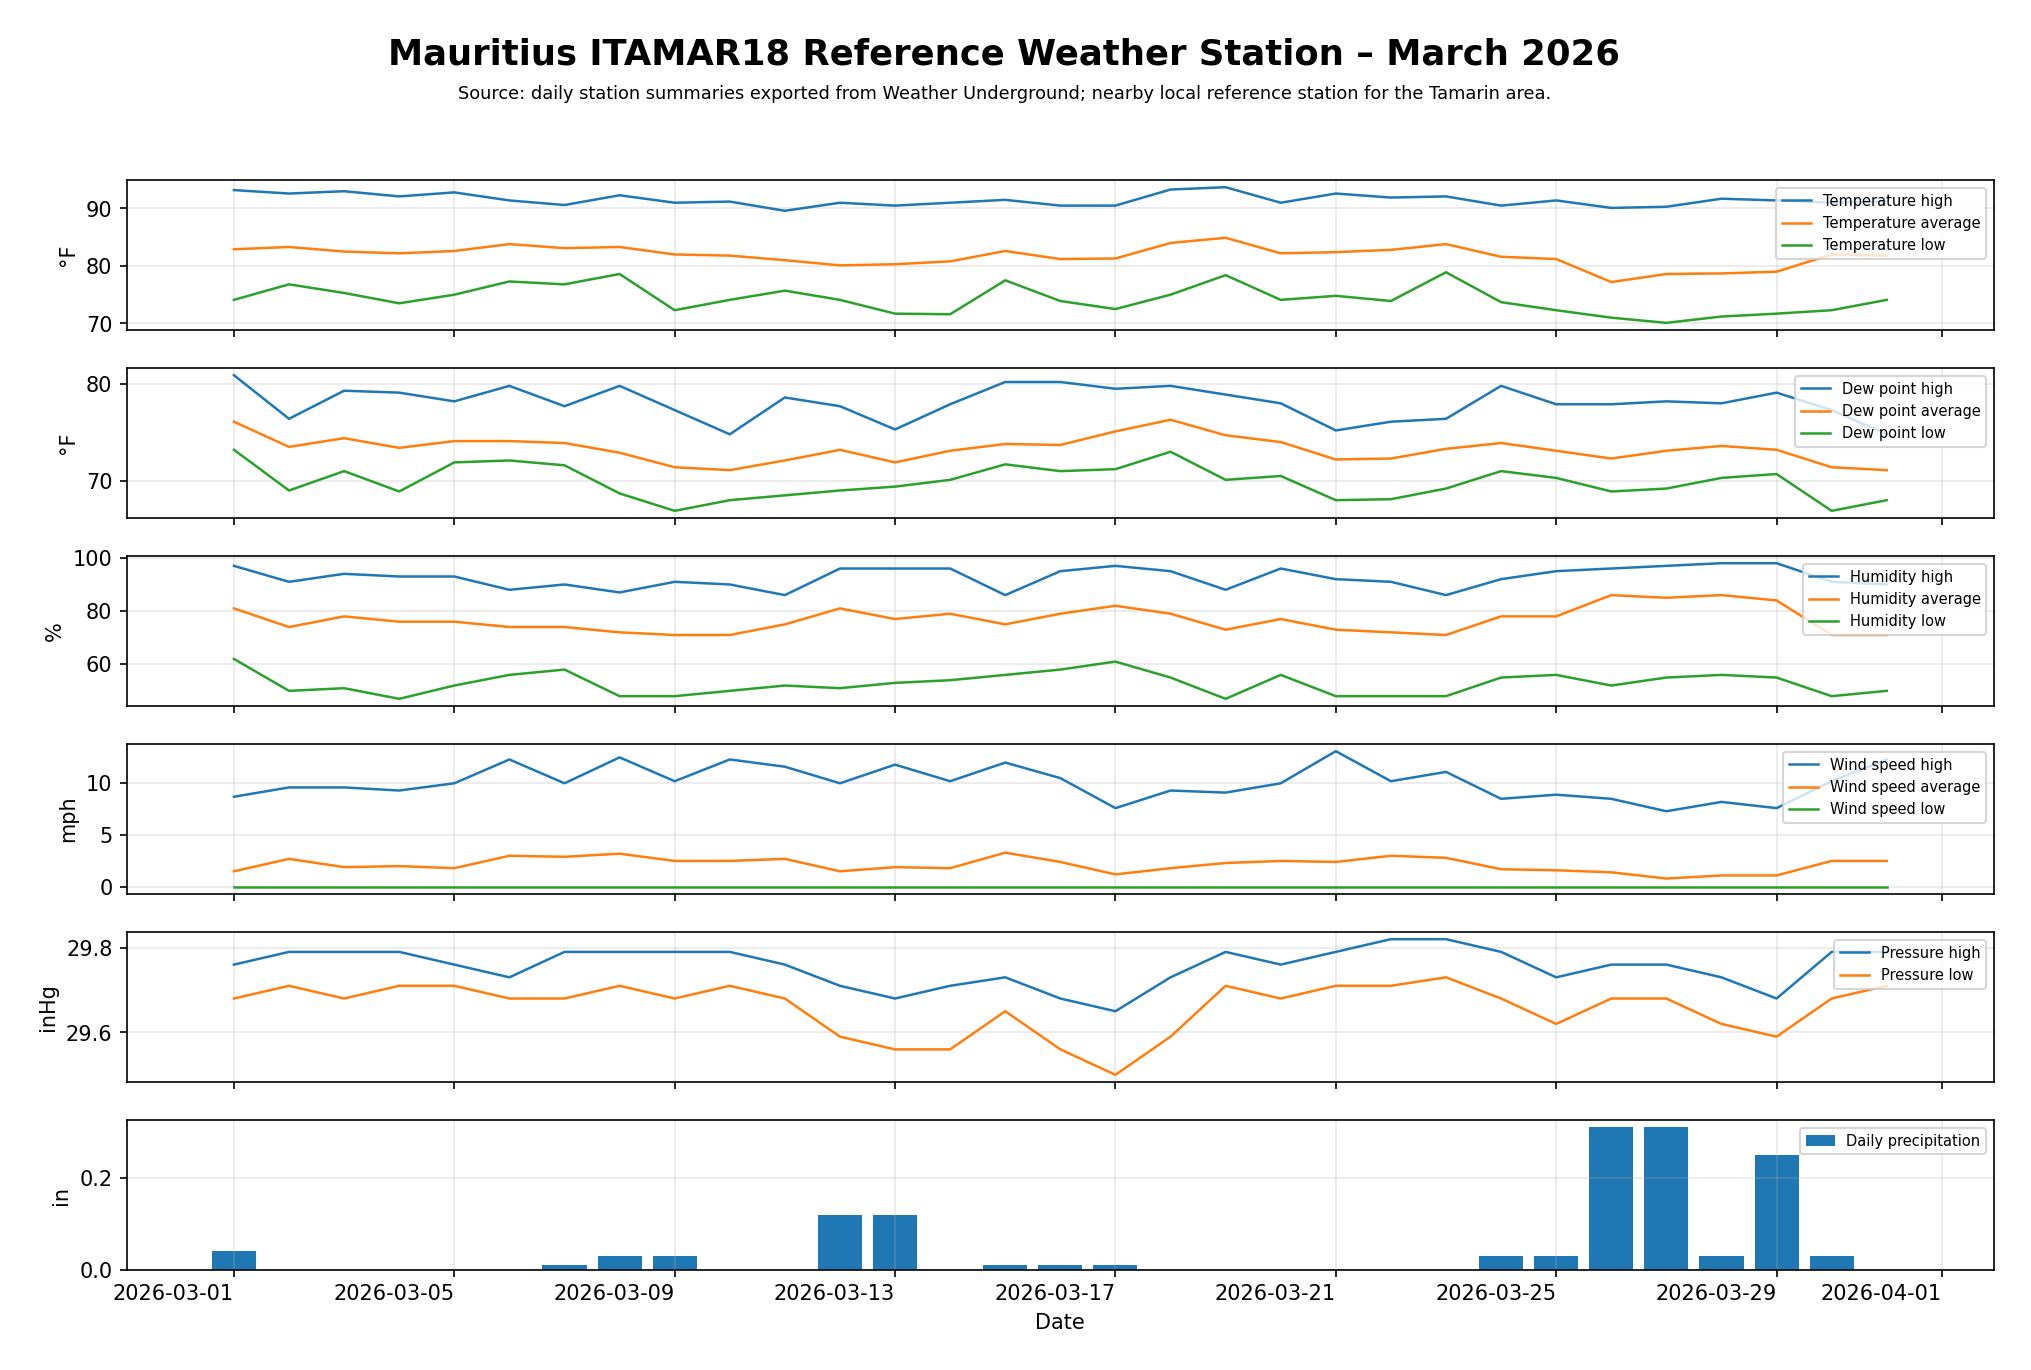 ITAMAR18 – March 2026
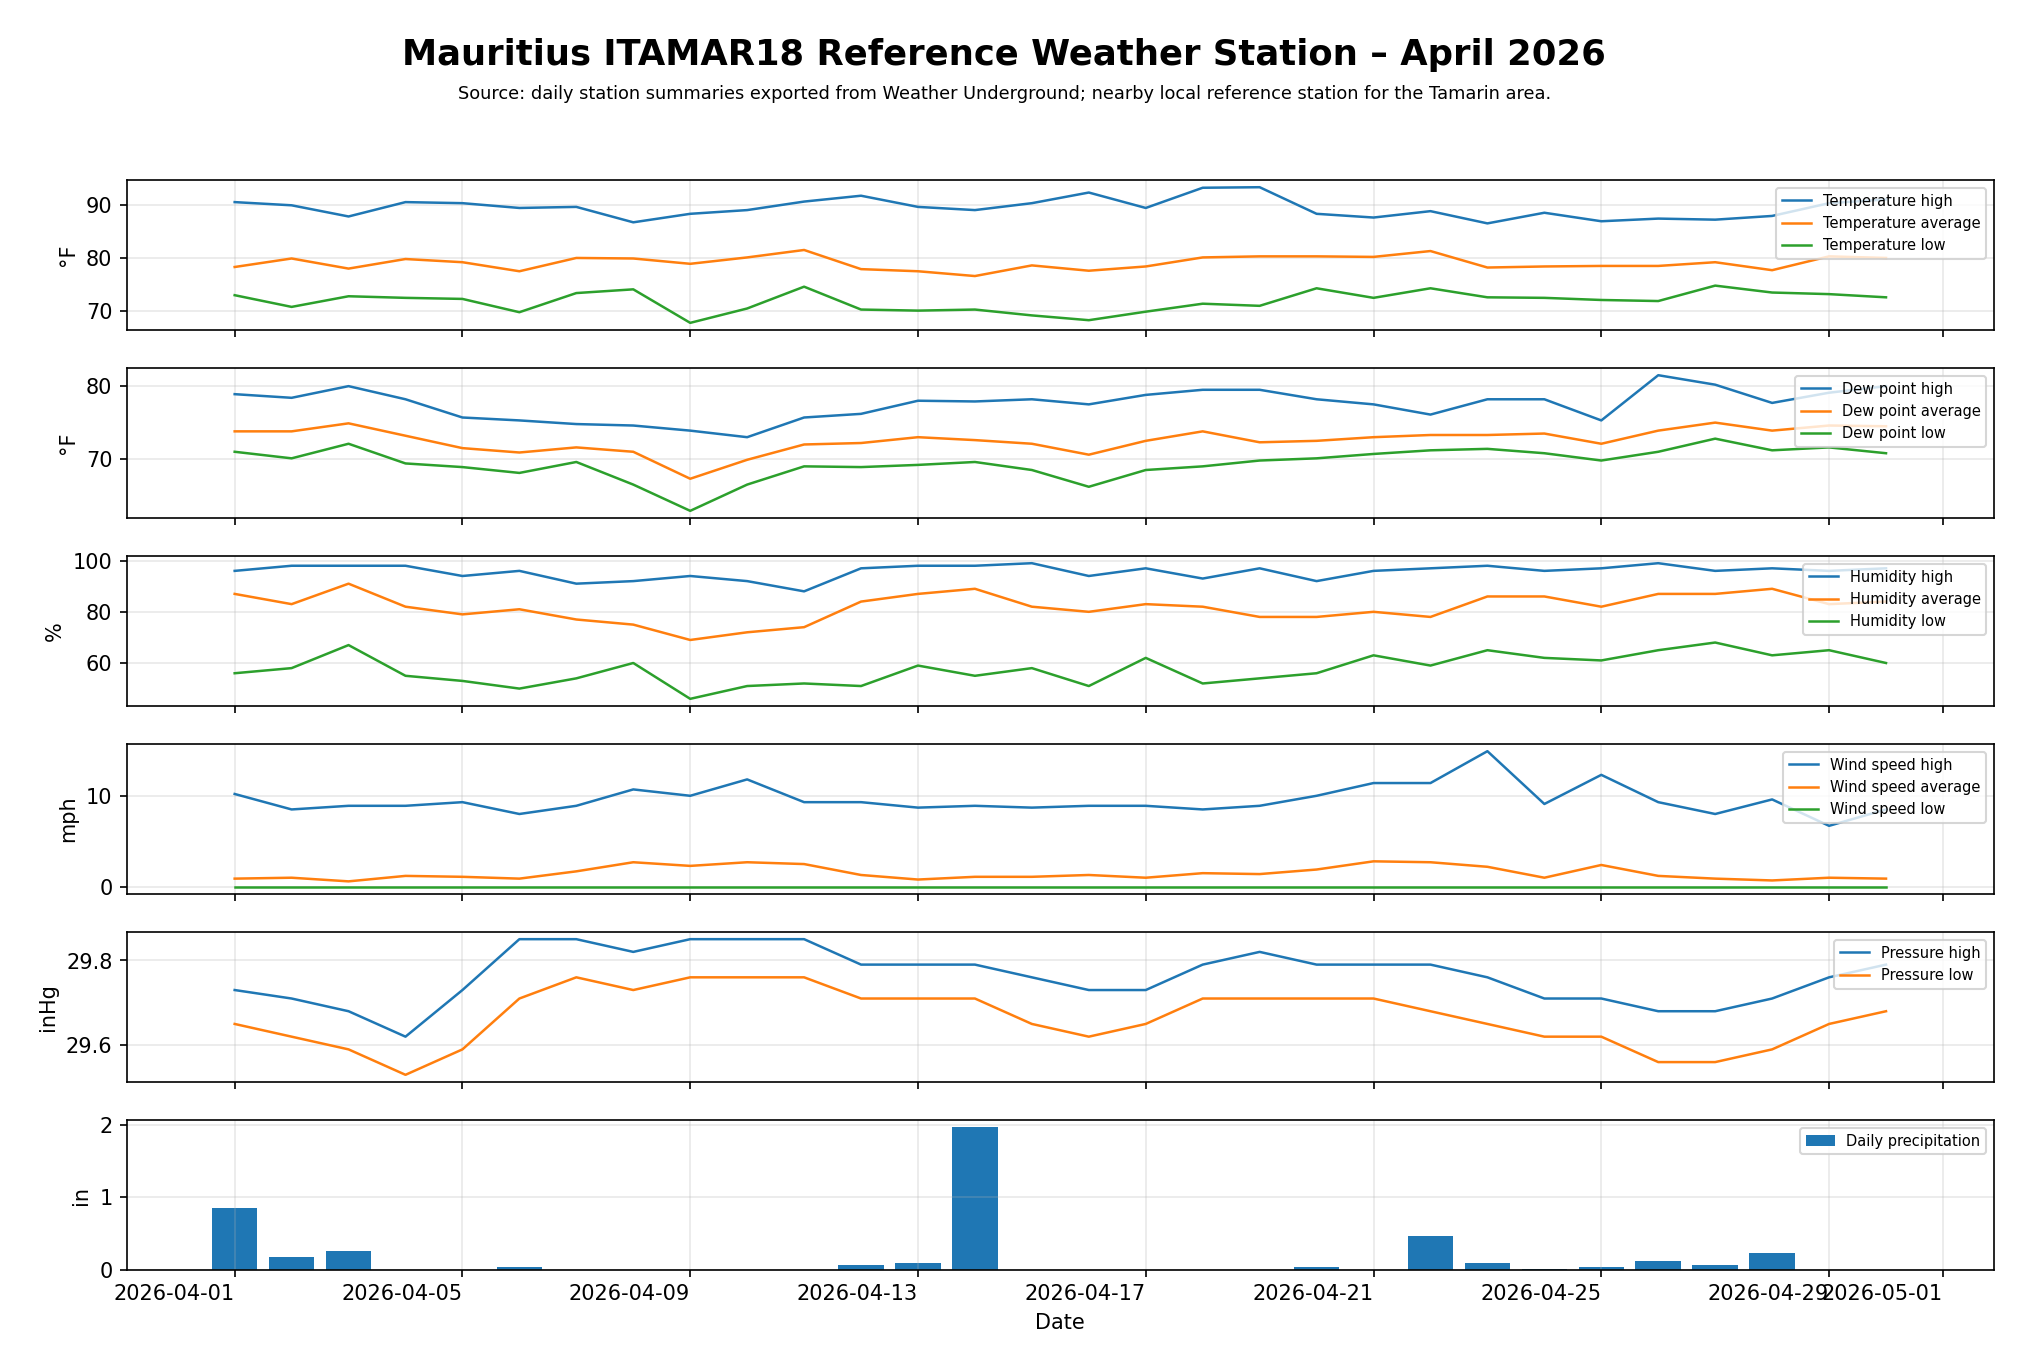 ITAMAR18 – April 2026
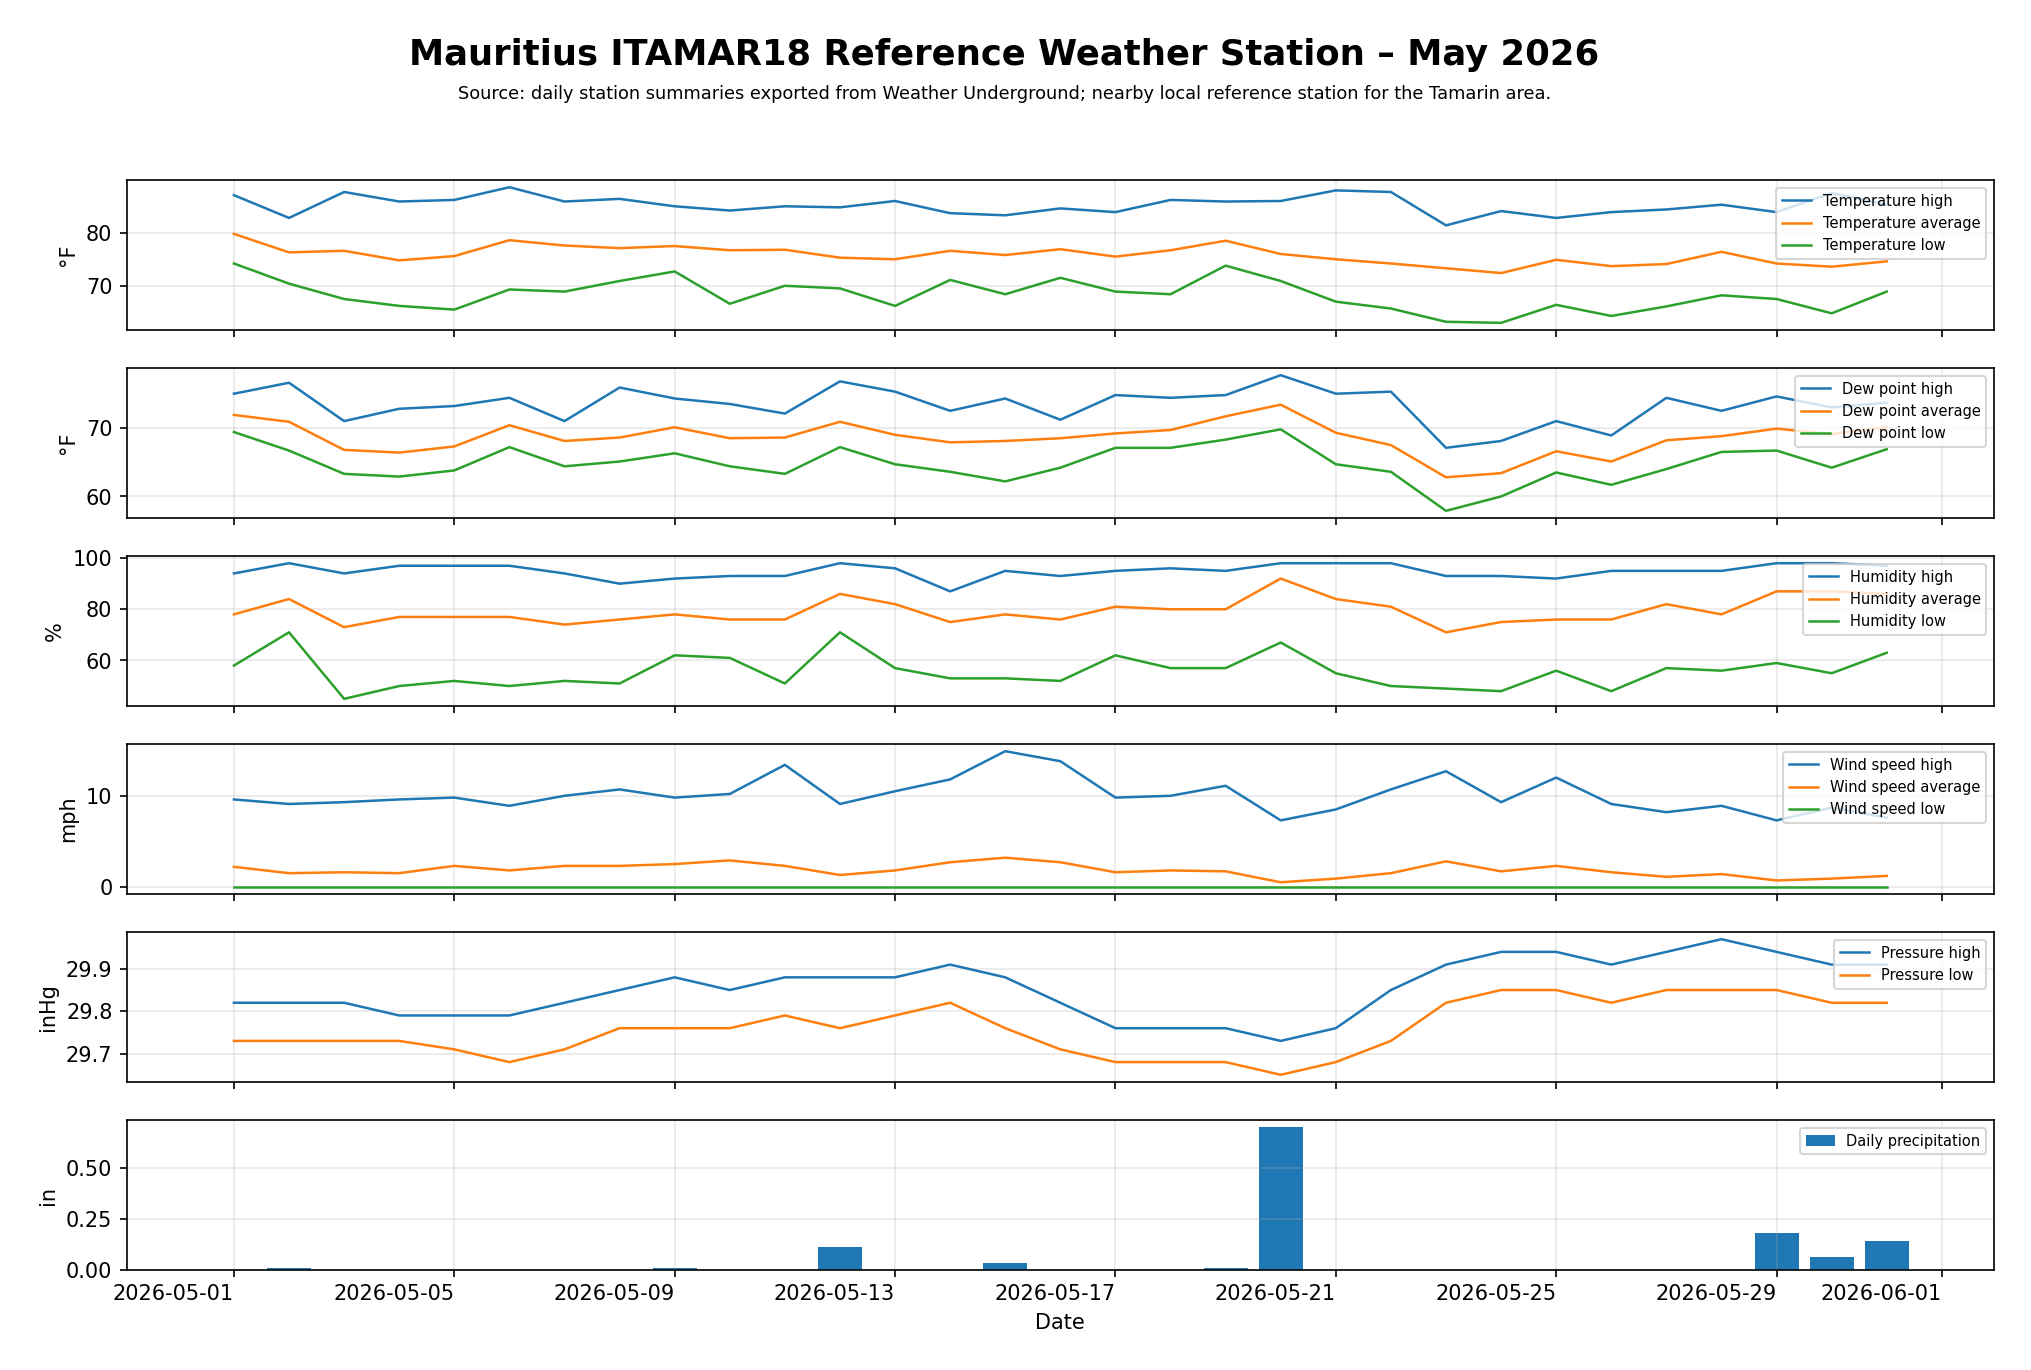 ITAMAR18 – May 2026
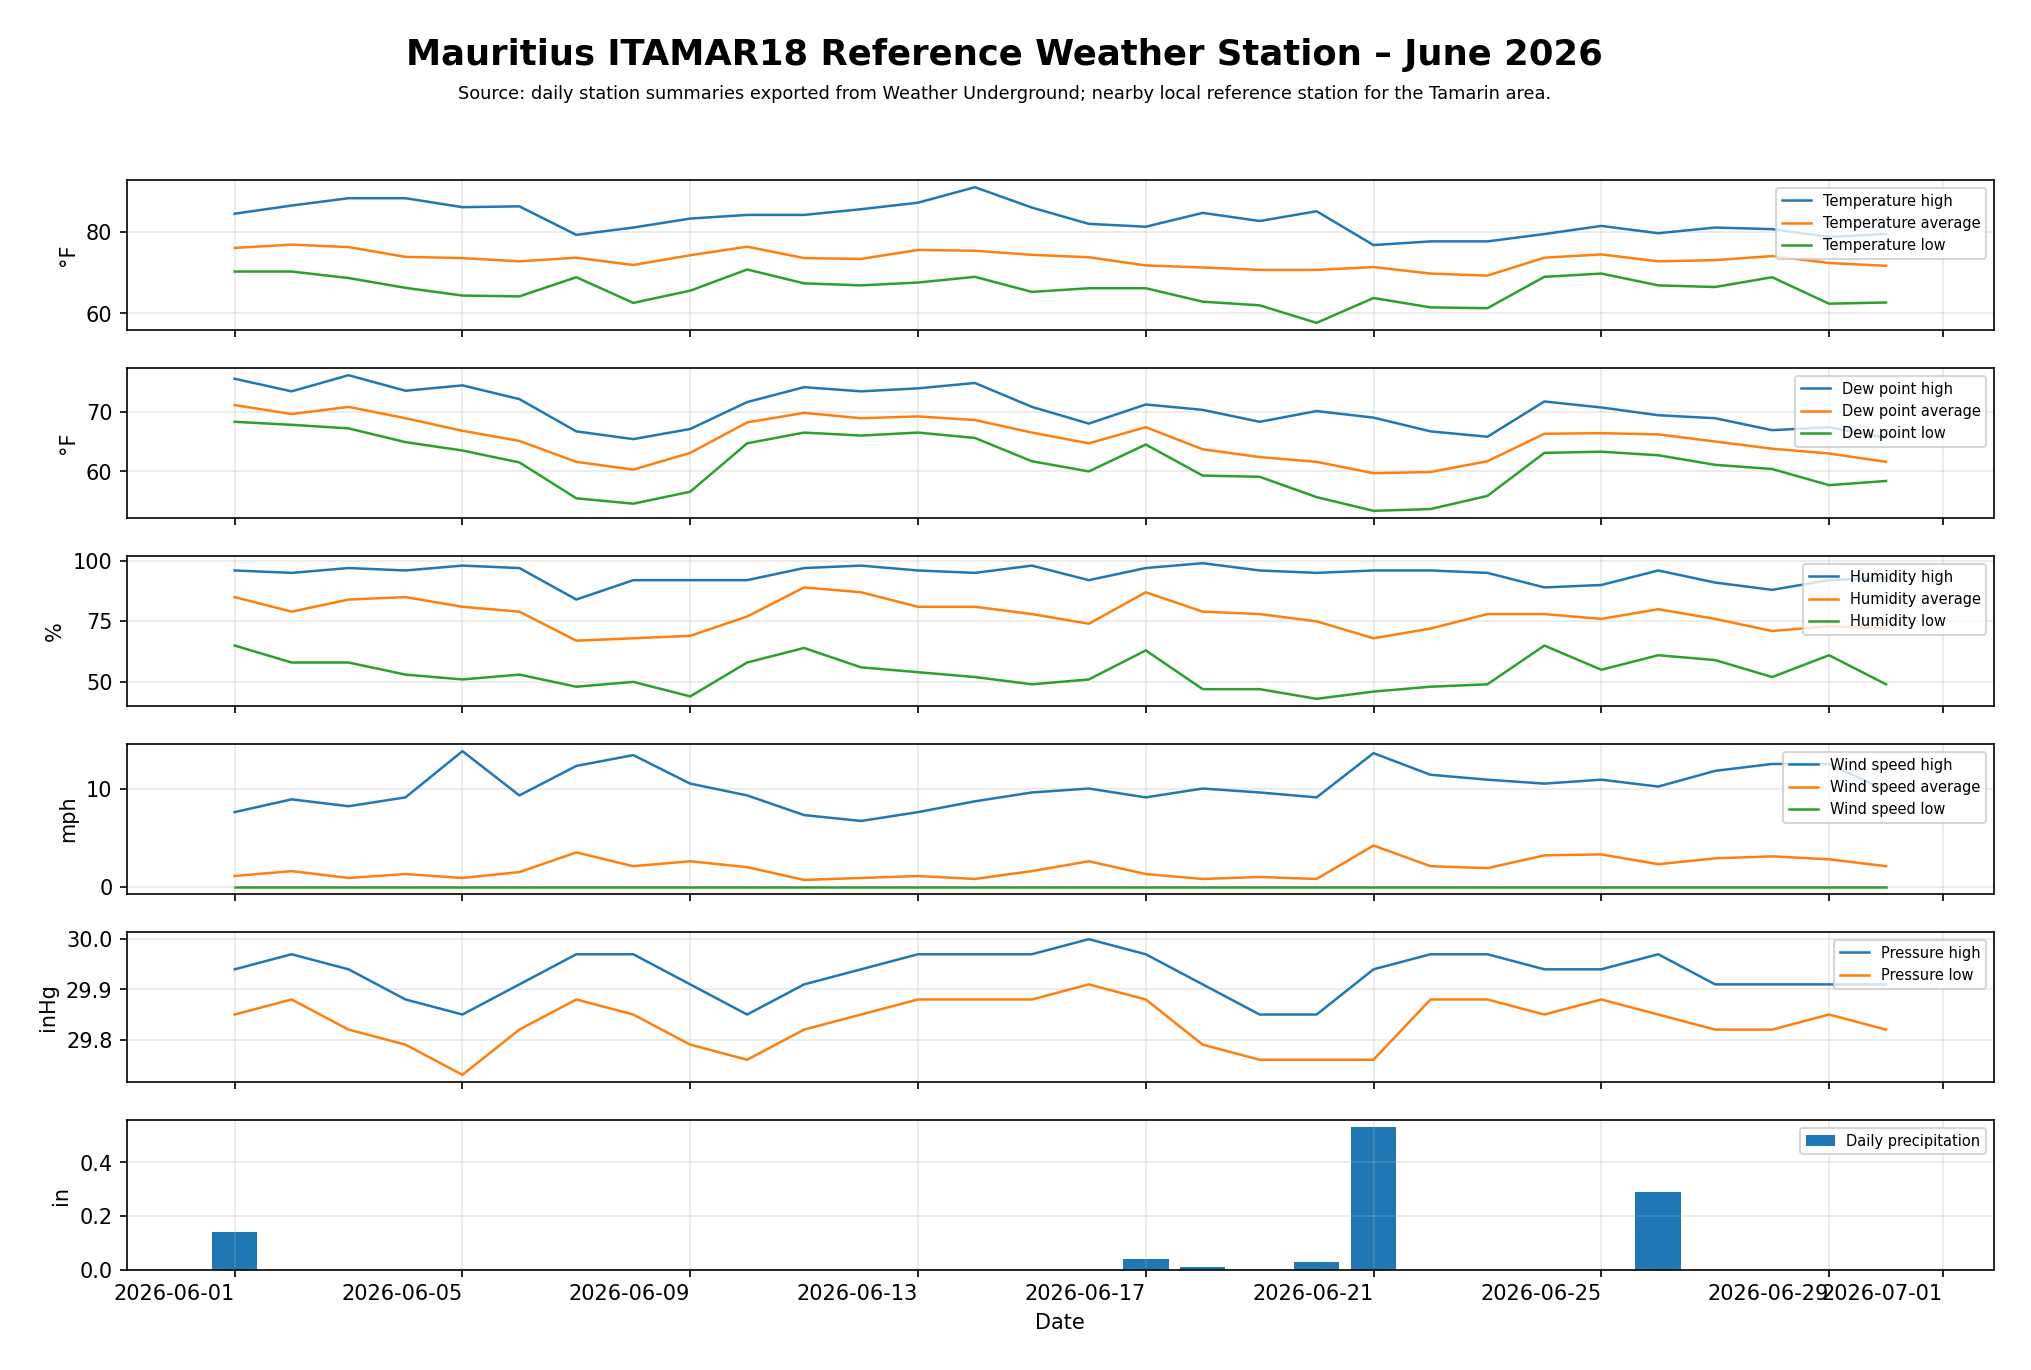 ITAMAR18 – June 2026
A structured dashboard of short recorded monitoring feeds and grouped visual records from the Mauritius experimental field.
Downloadable weather microdata are available for the ITAMAR23 project station and the nearby ITAMAR18 reference station.
Mauritius microdata XLSX ITAMAR23 March 2026 CSV ITAMAR18 reference CSV Mauritius complete ZIPNearby reference weather station IENTON1 is used to provide monitoring context for the Loitokitok area in Kenya.
The station provides available daily weather records, including temperature, dew point, humidity, wind speed, pressure and precipitation where available. Data availability varies between monitoring periods; some months contain full daily weather-station records, while selected periods include partial sensor data only.
Open full monitoring dashboard
Selected available weather charts for the Loitokitok area are presented as nearby reference monitoring records for the period April 2025 to June 2026.
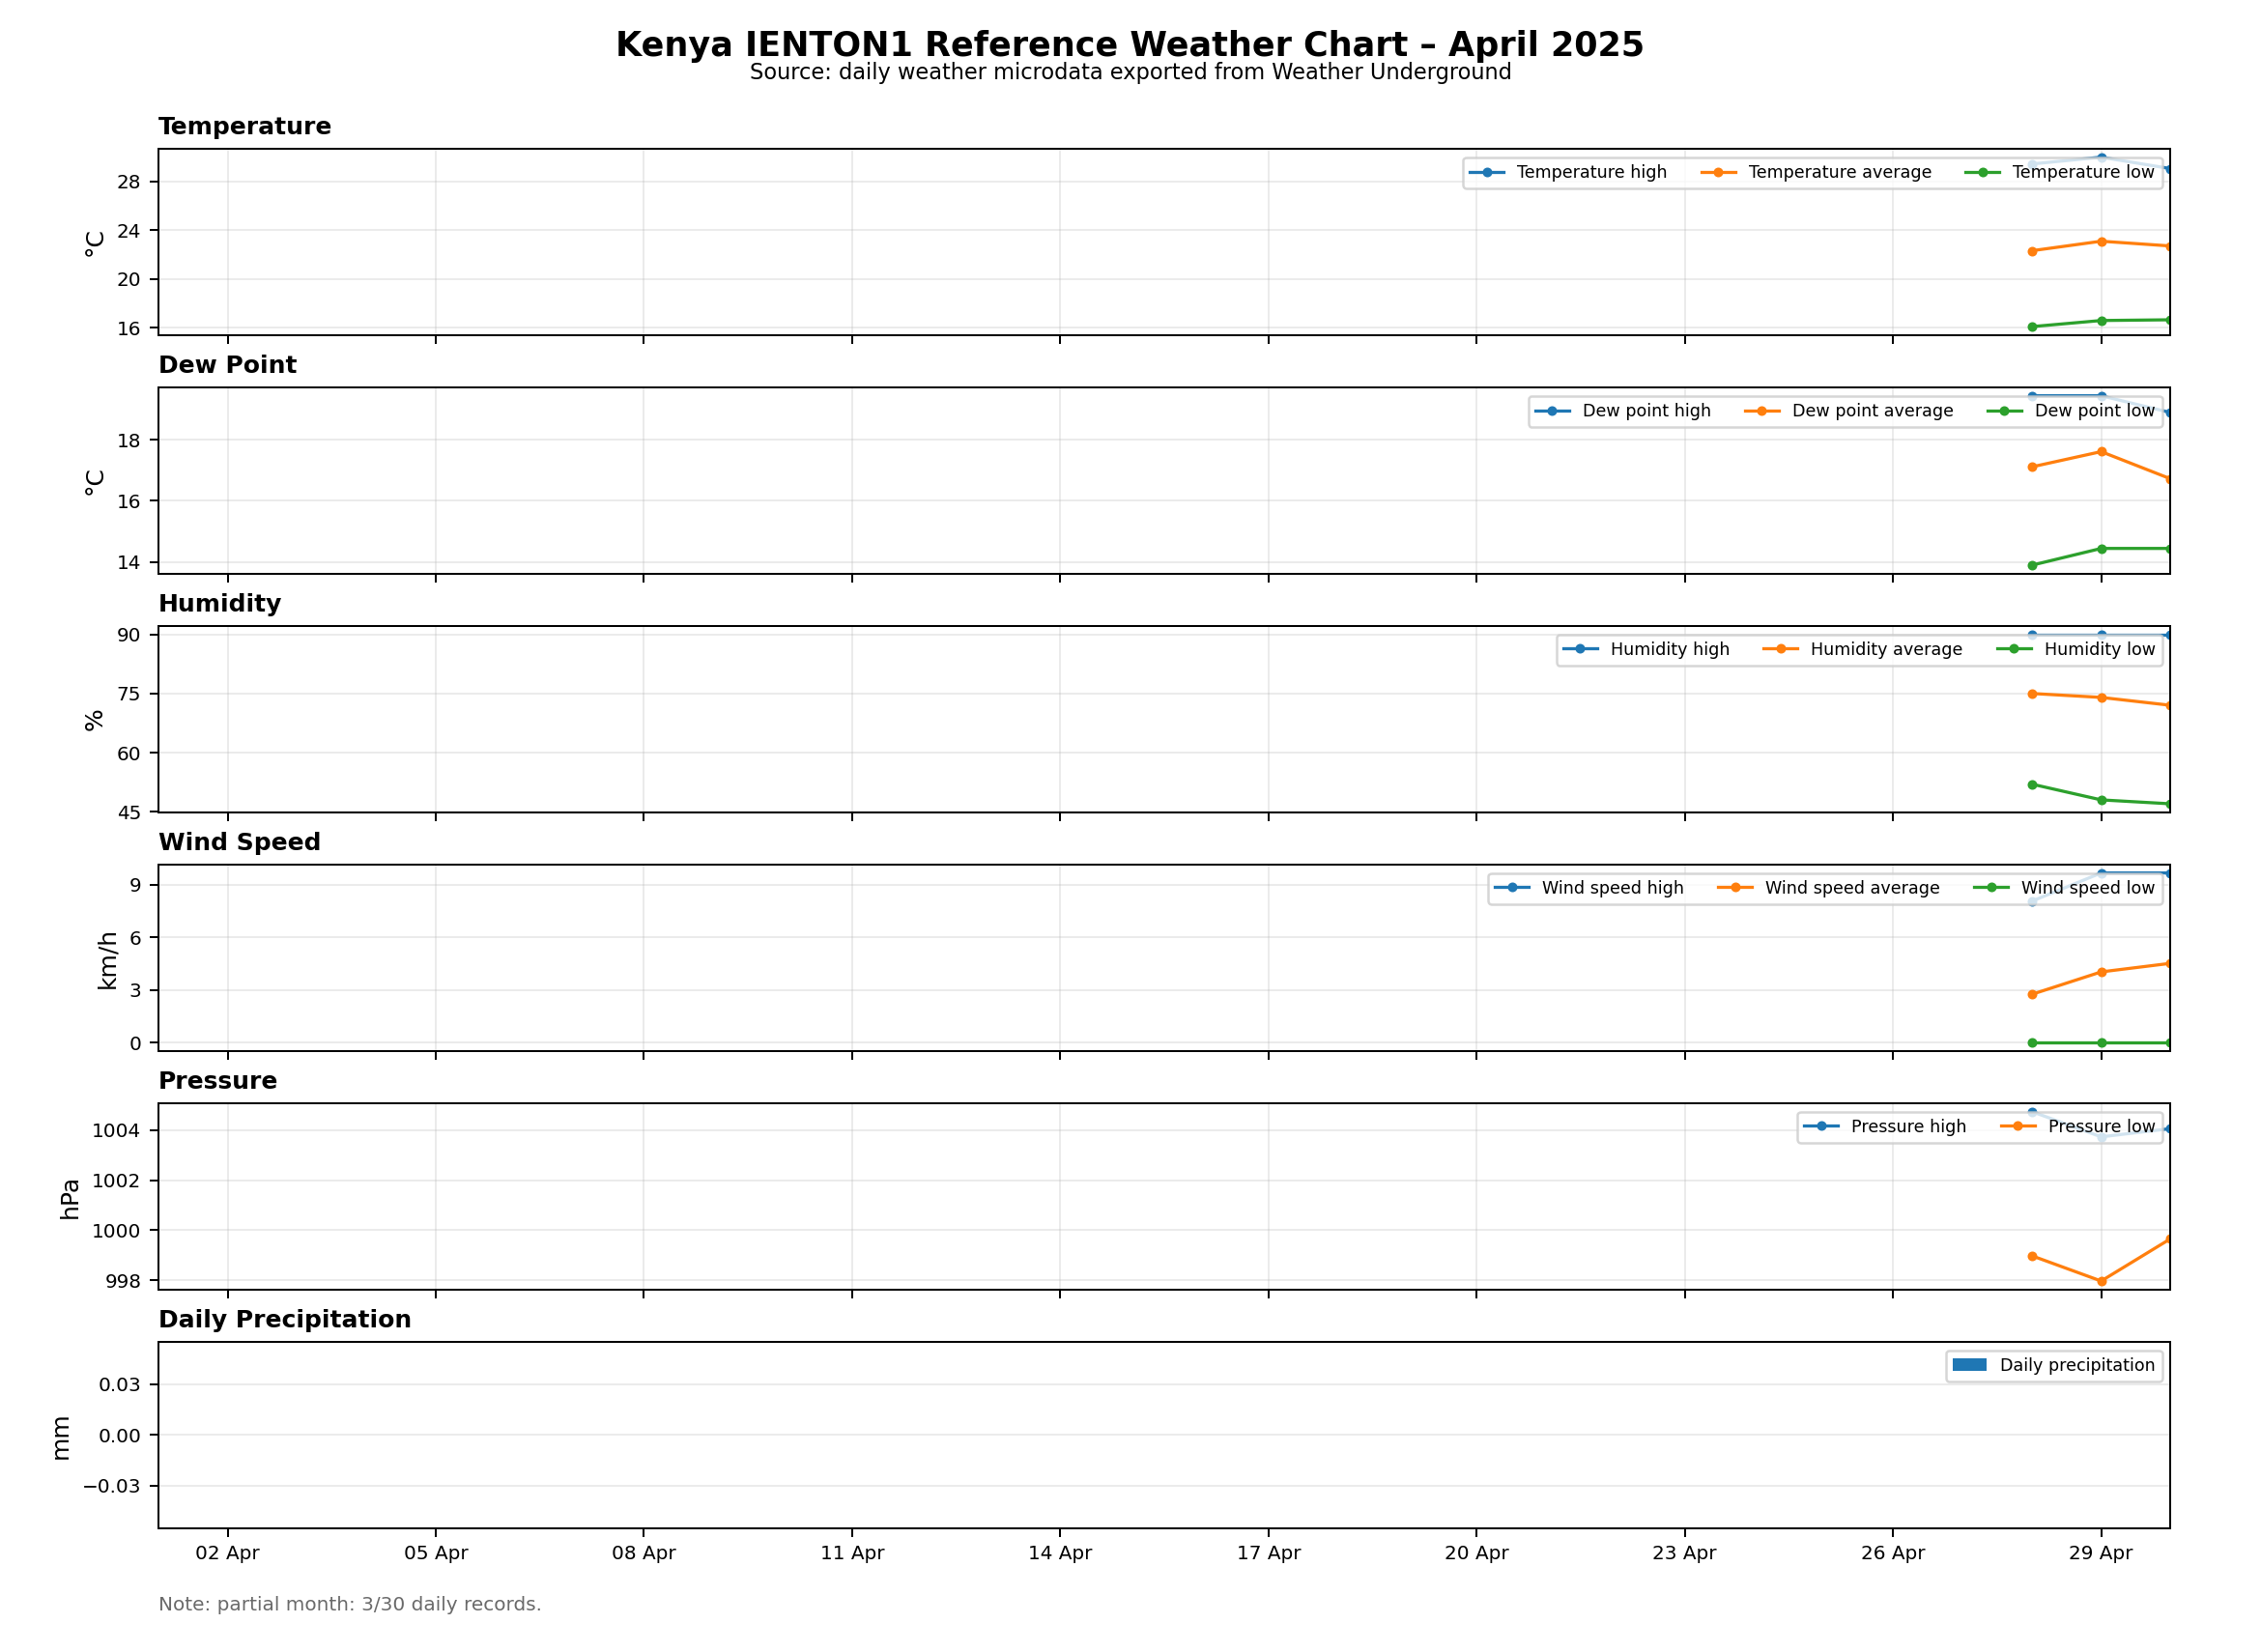 April 2025
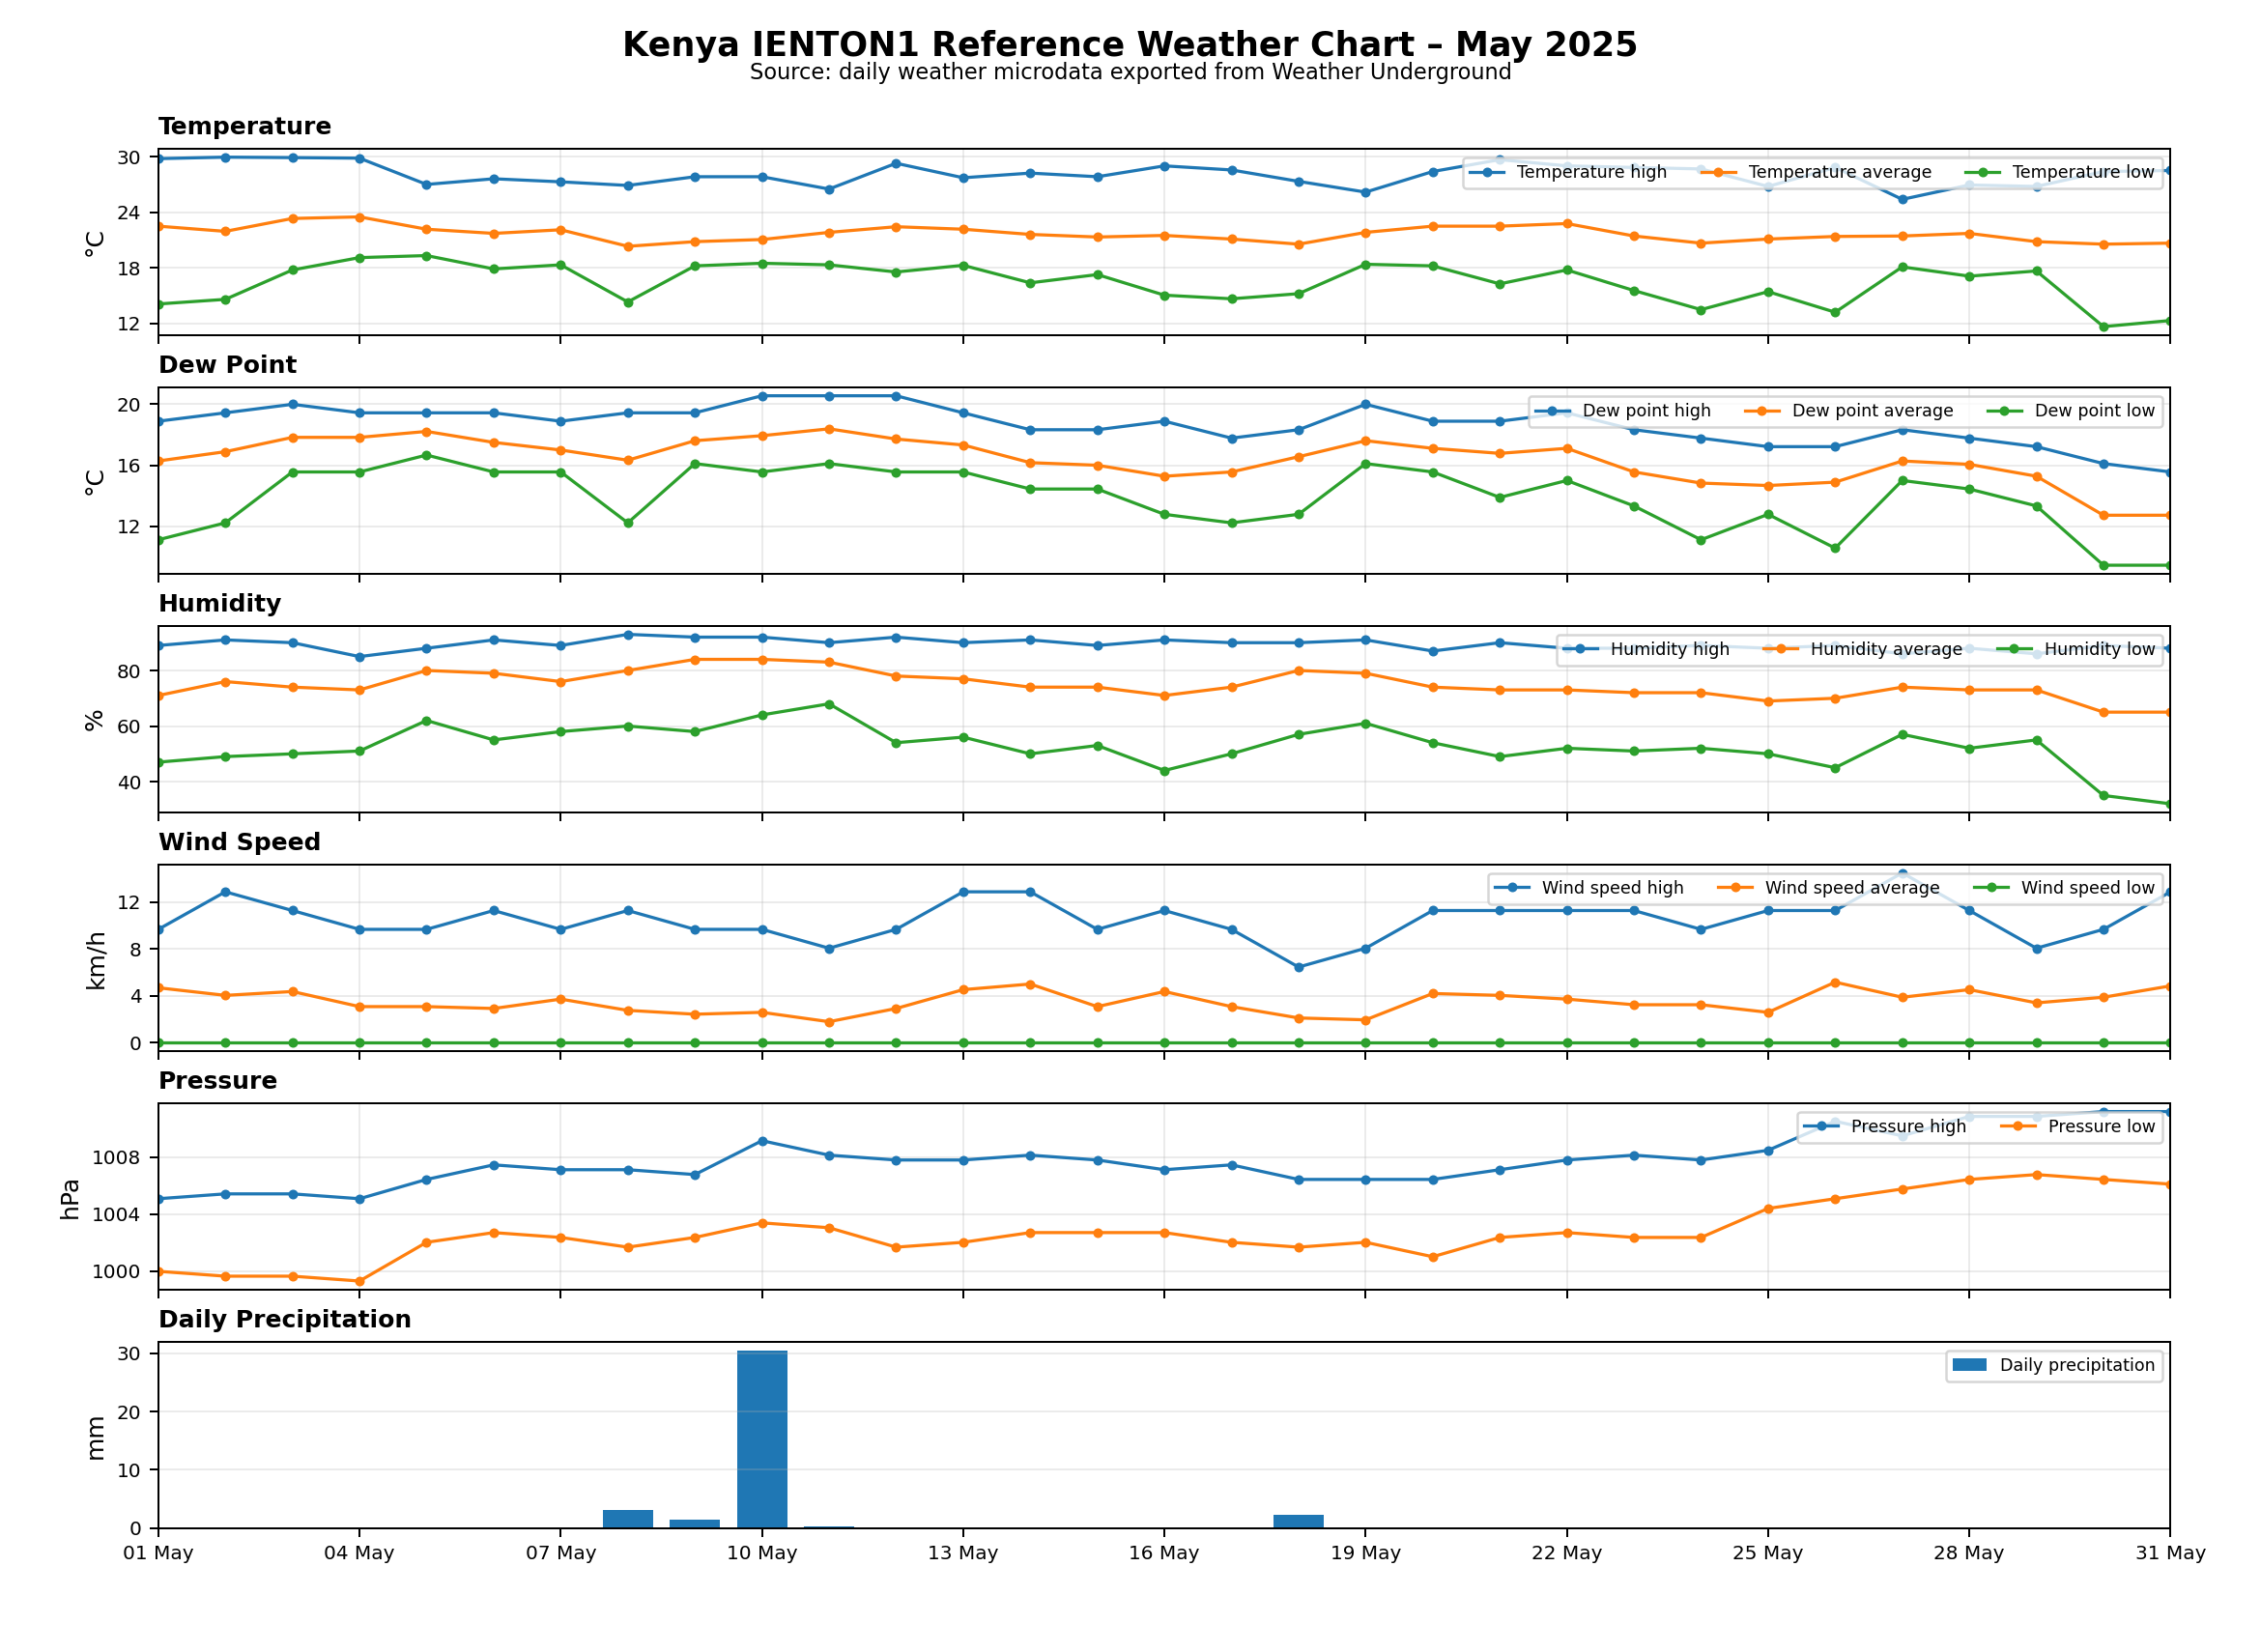 May 2025
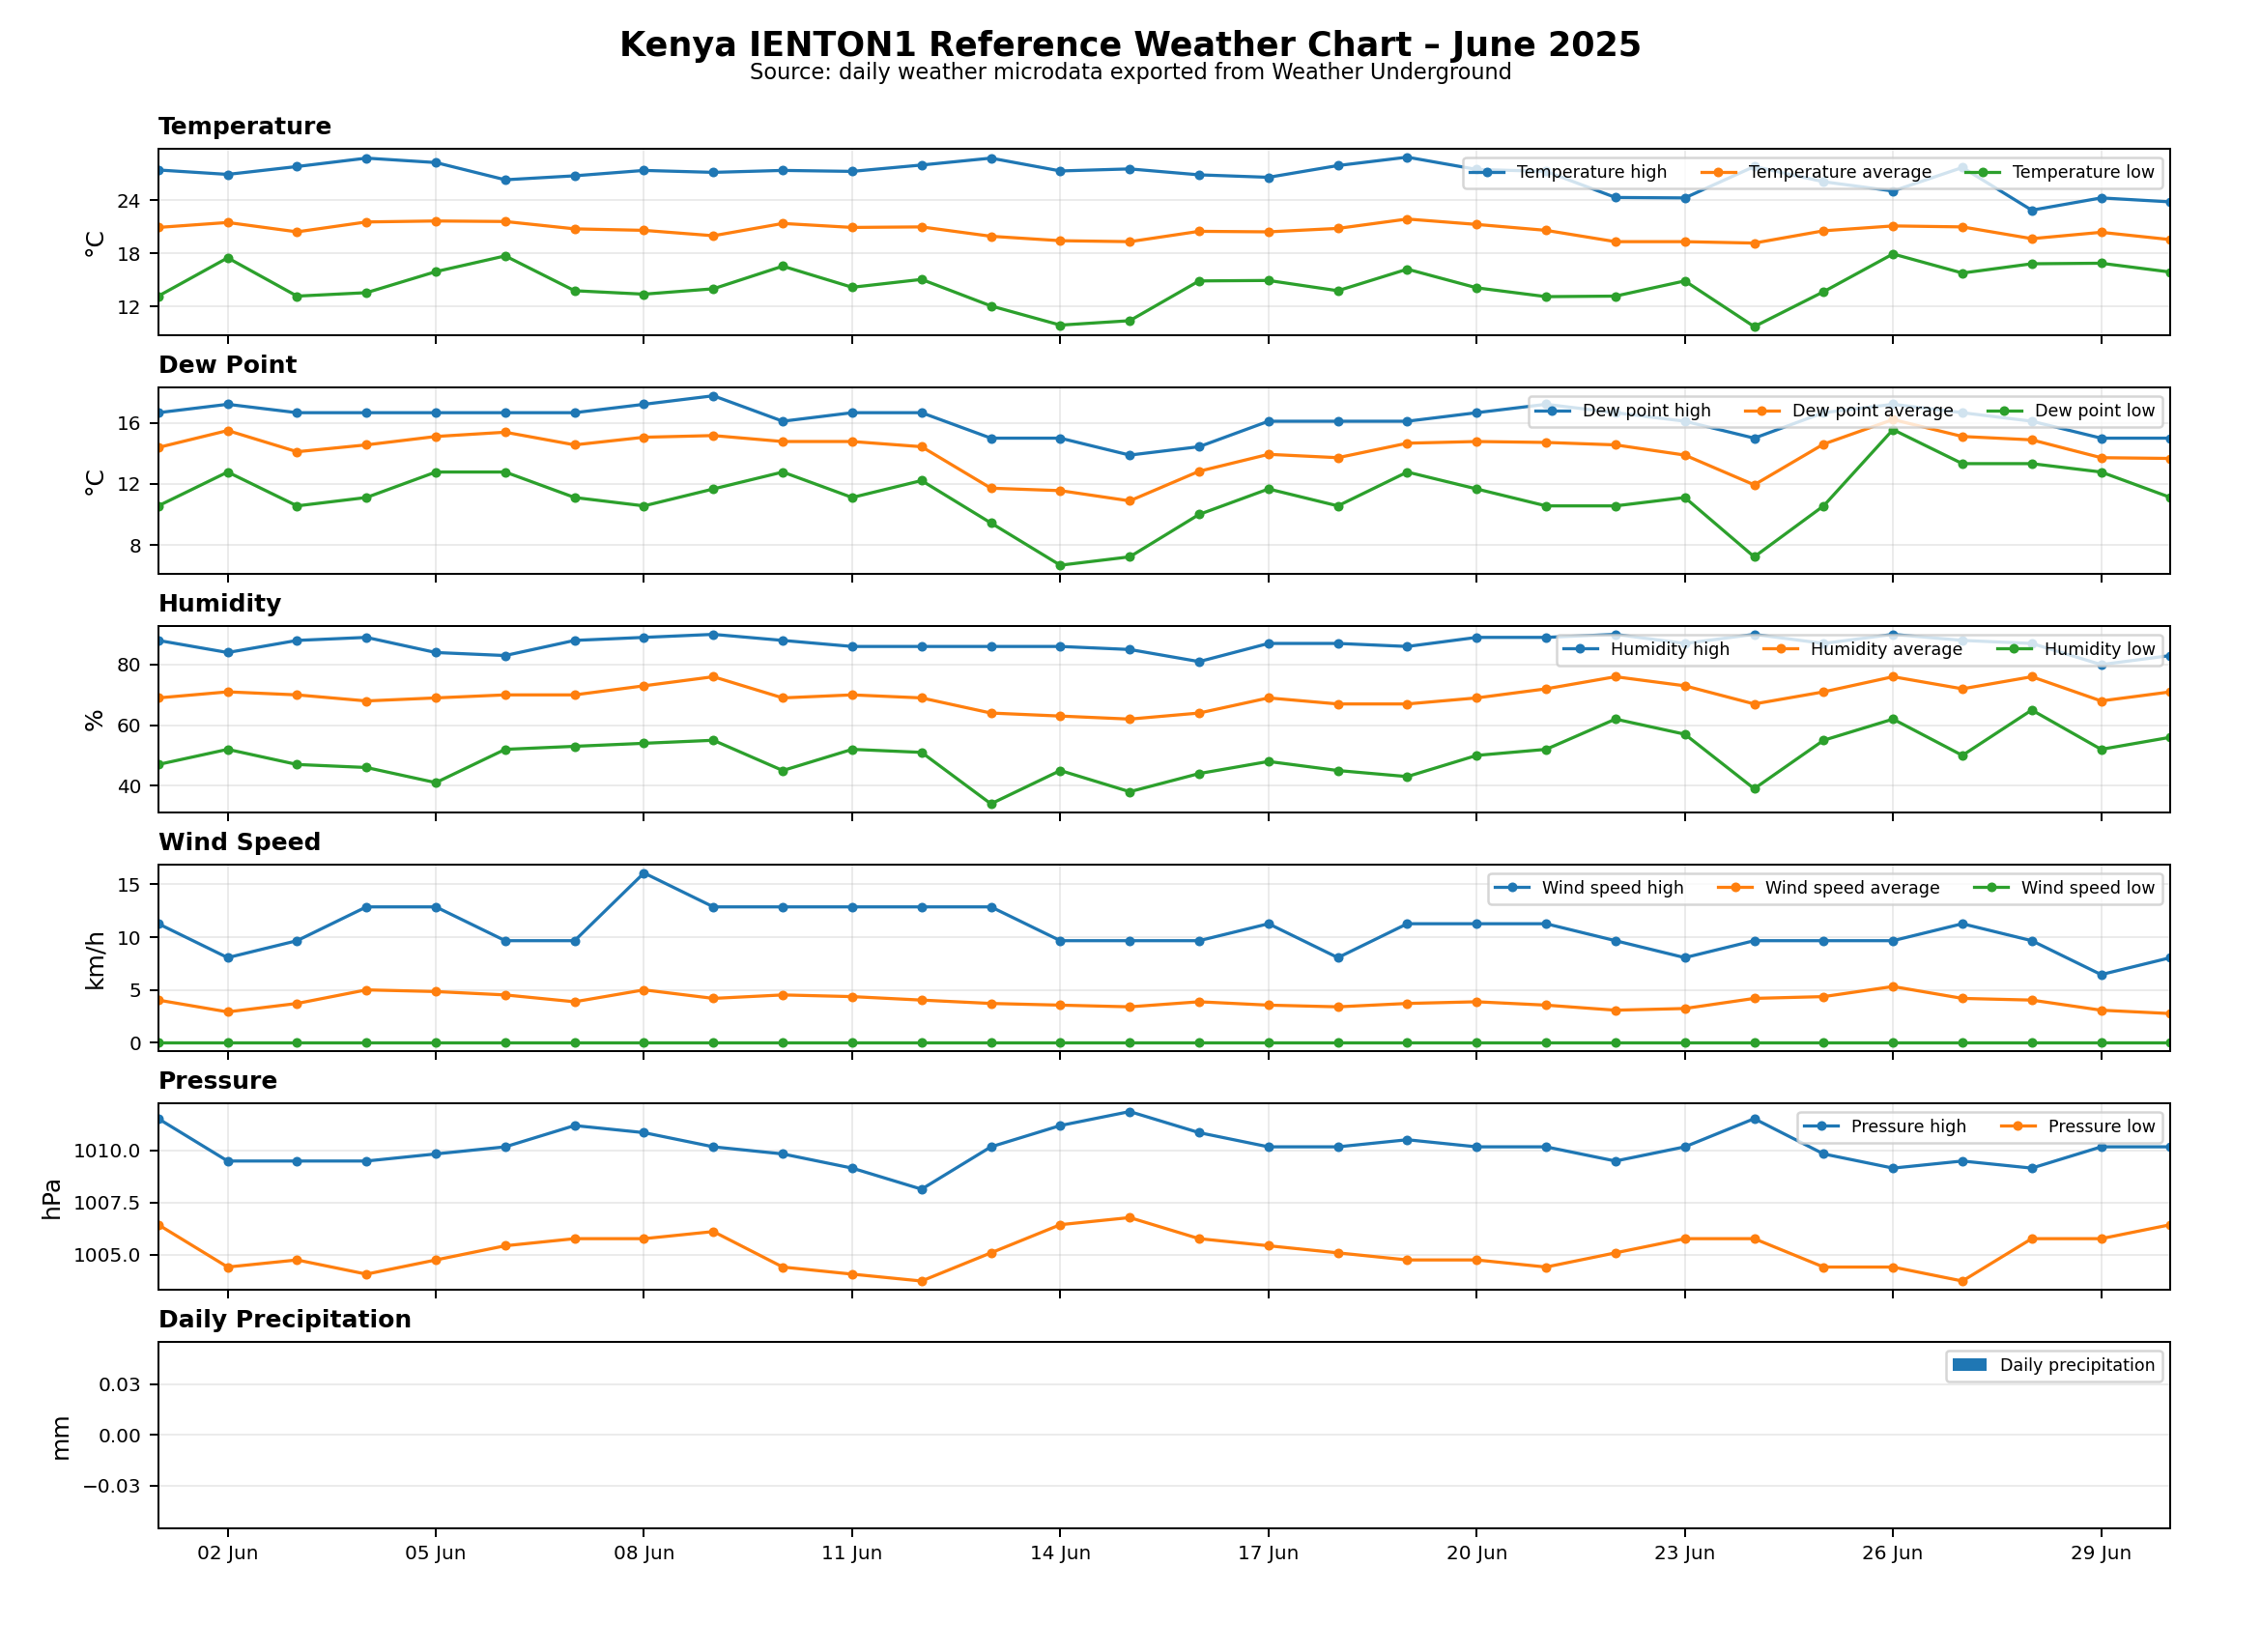 June 2025
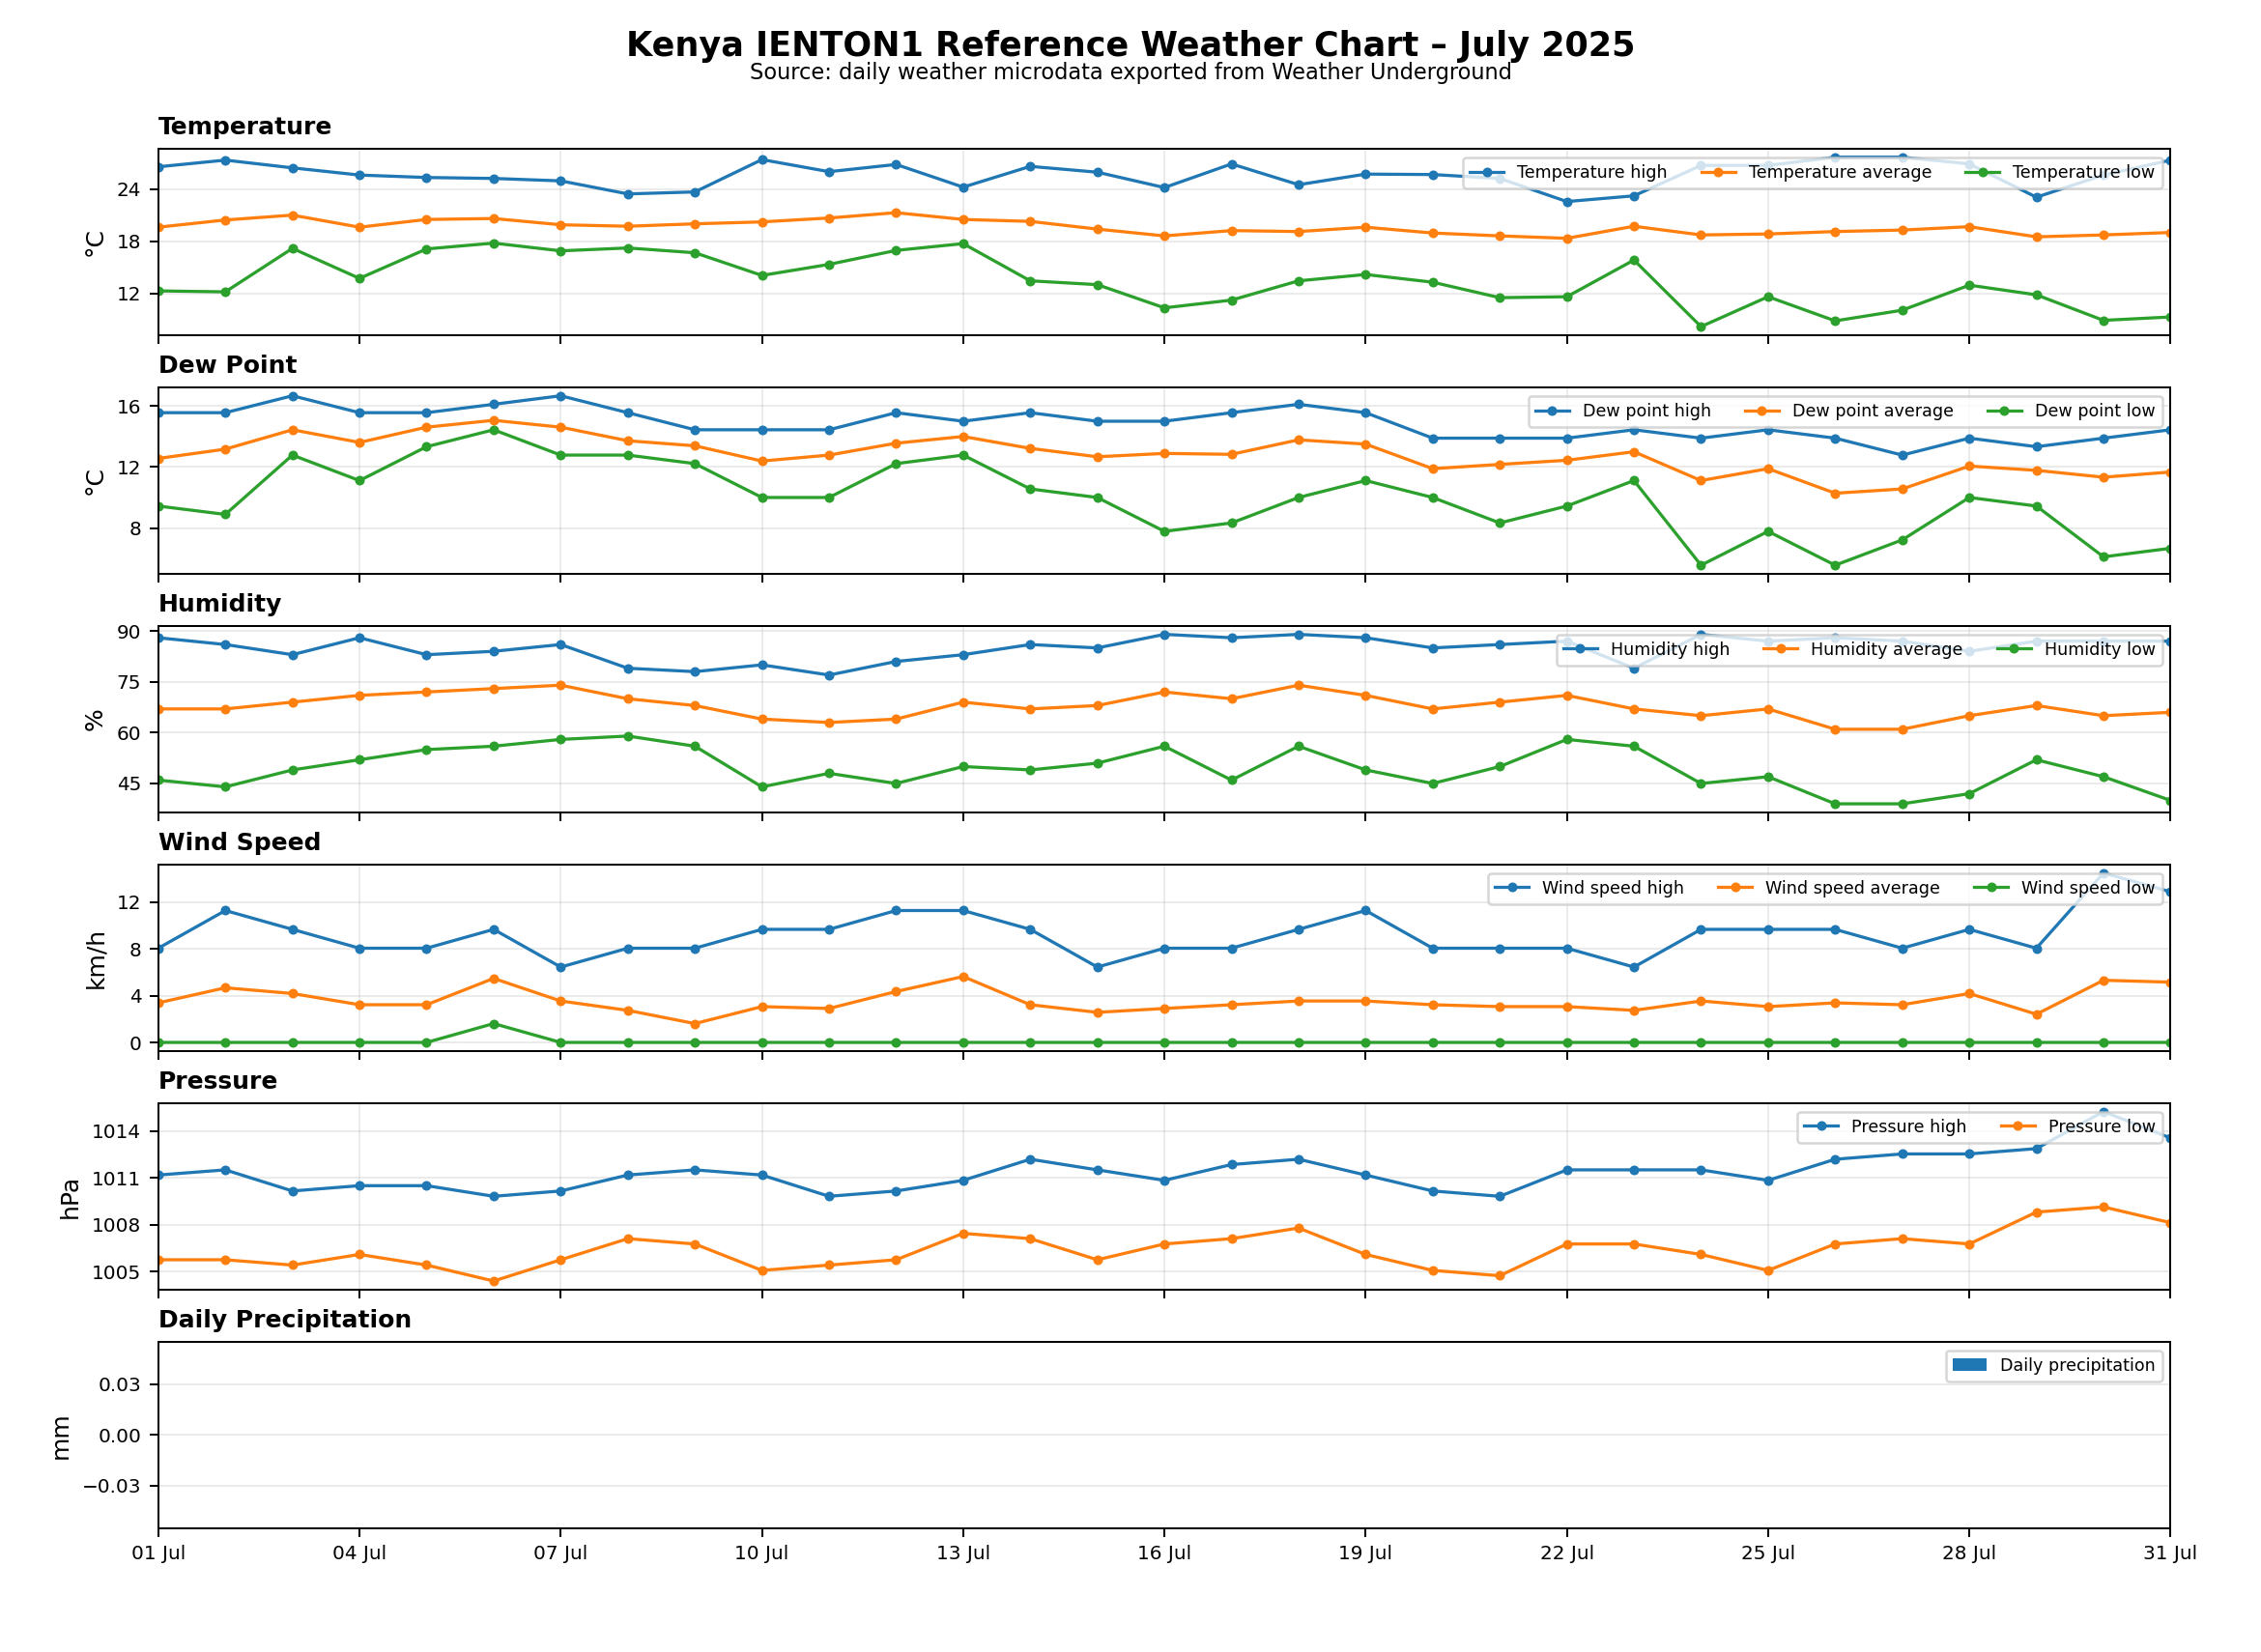 July 2025
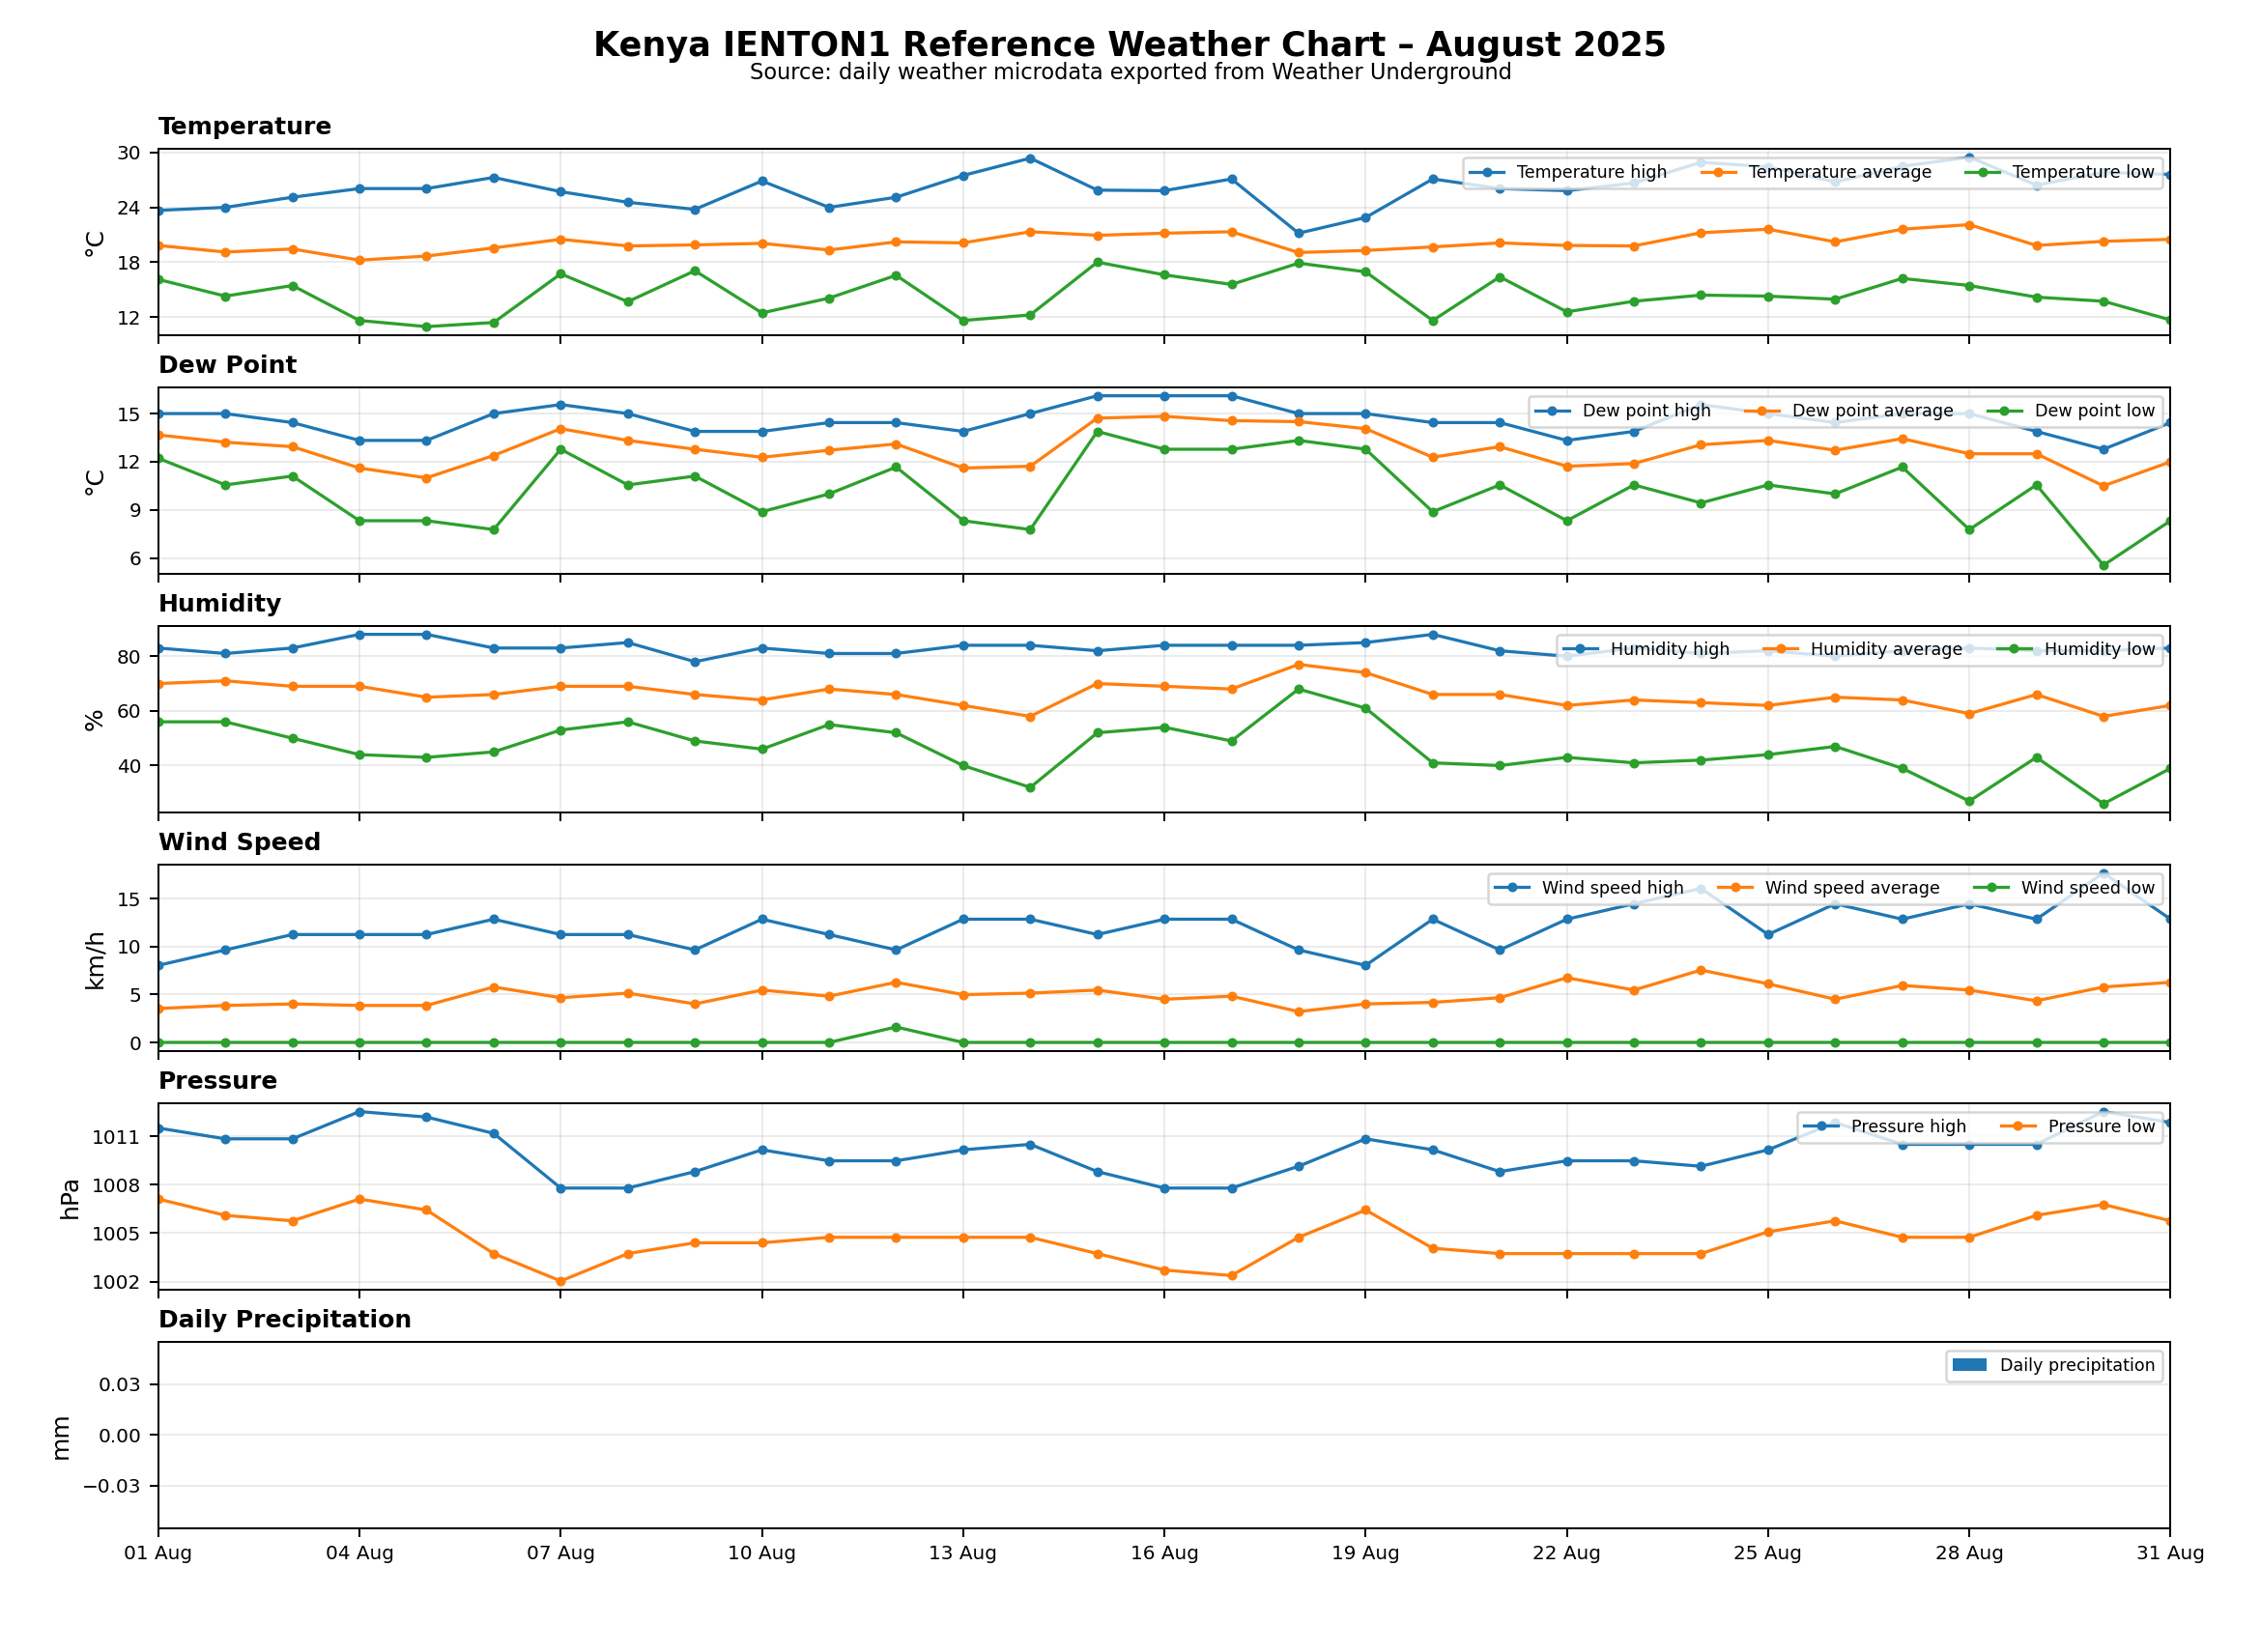 August 2025
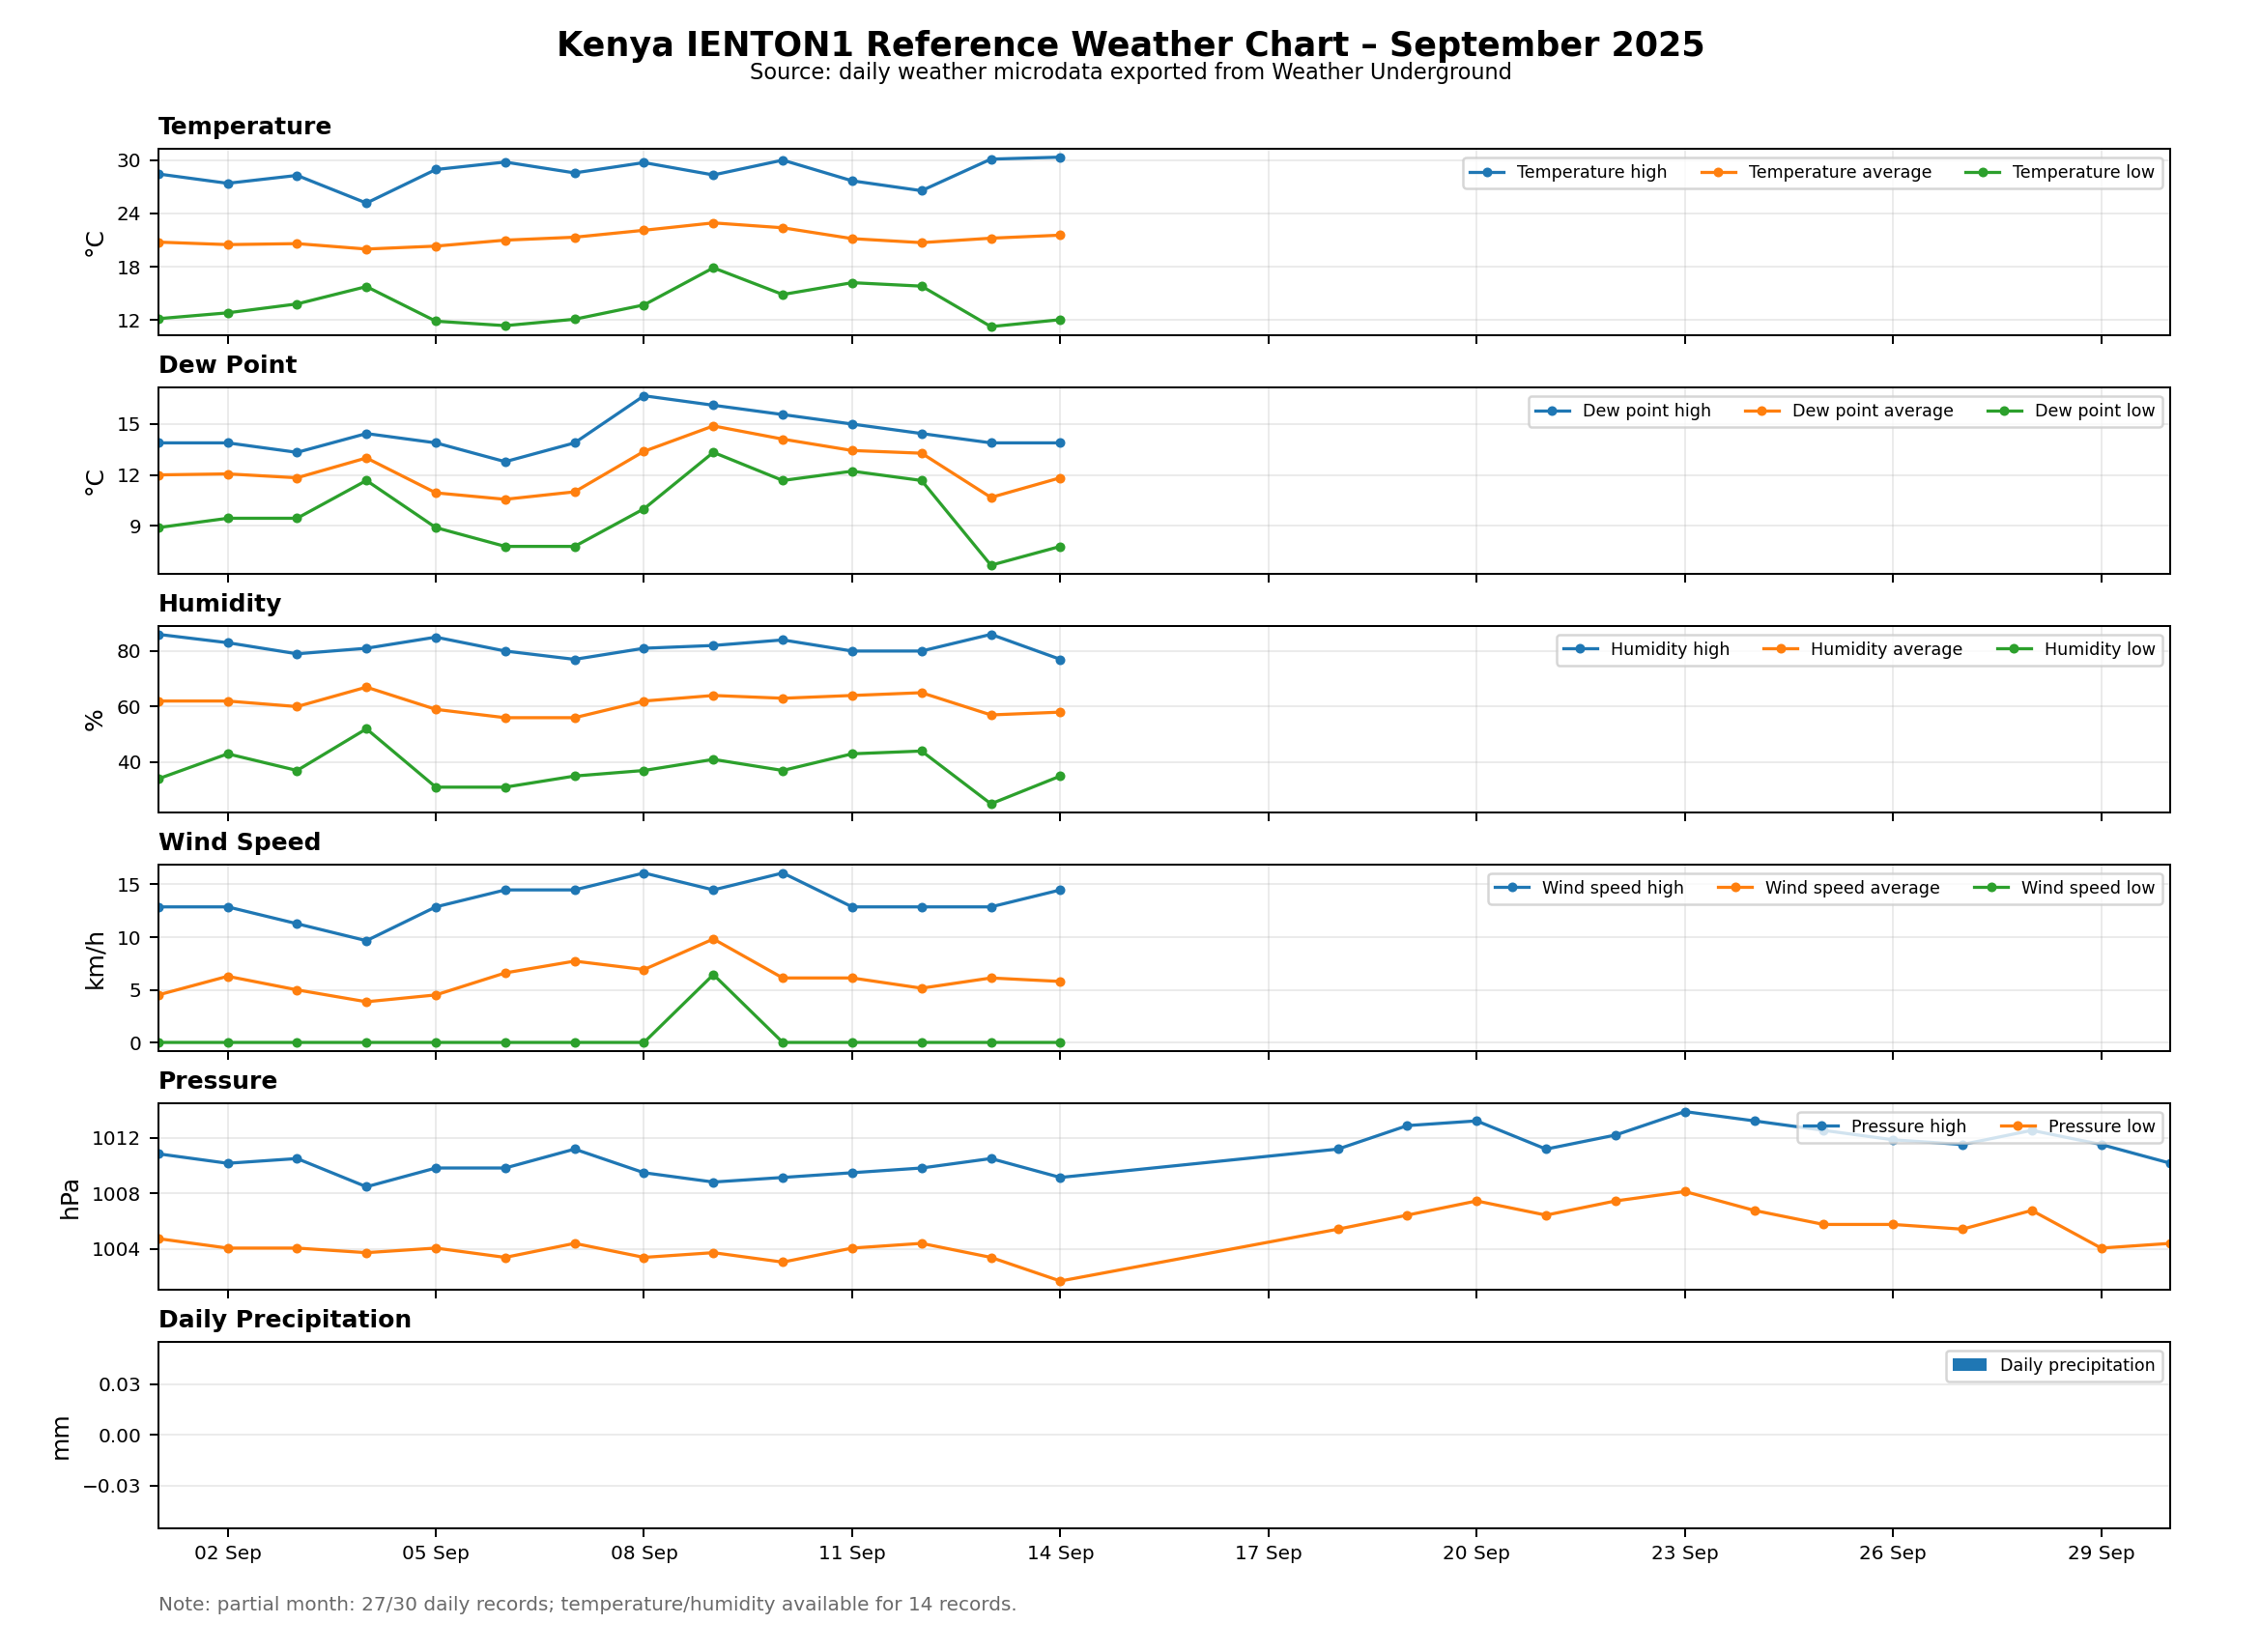 September 2025
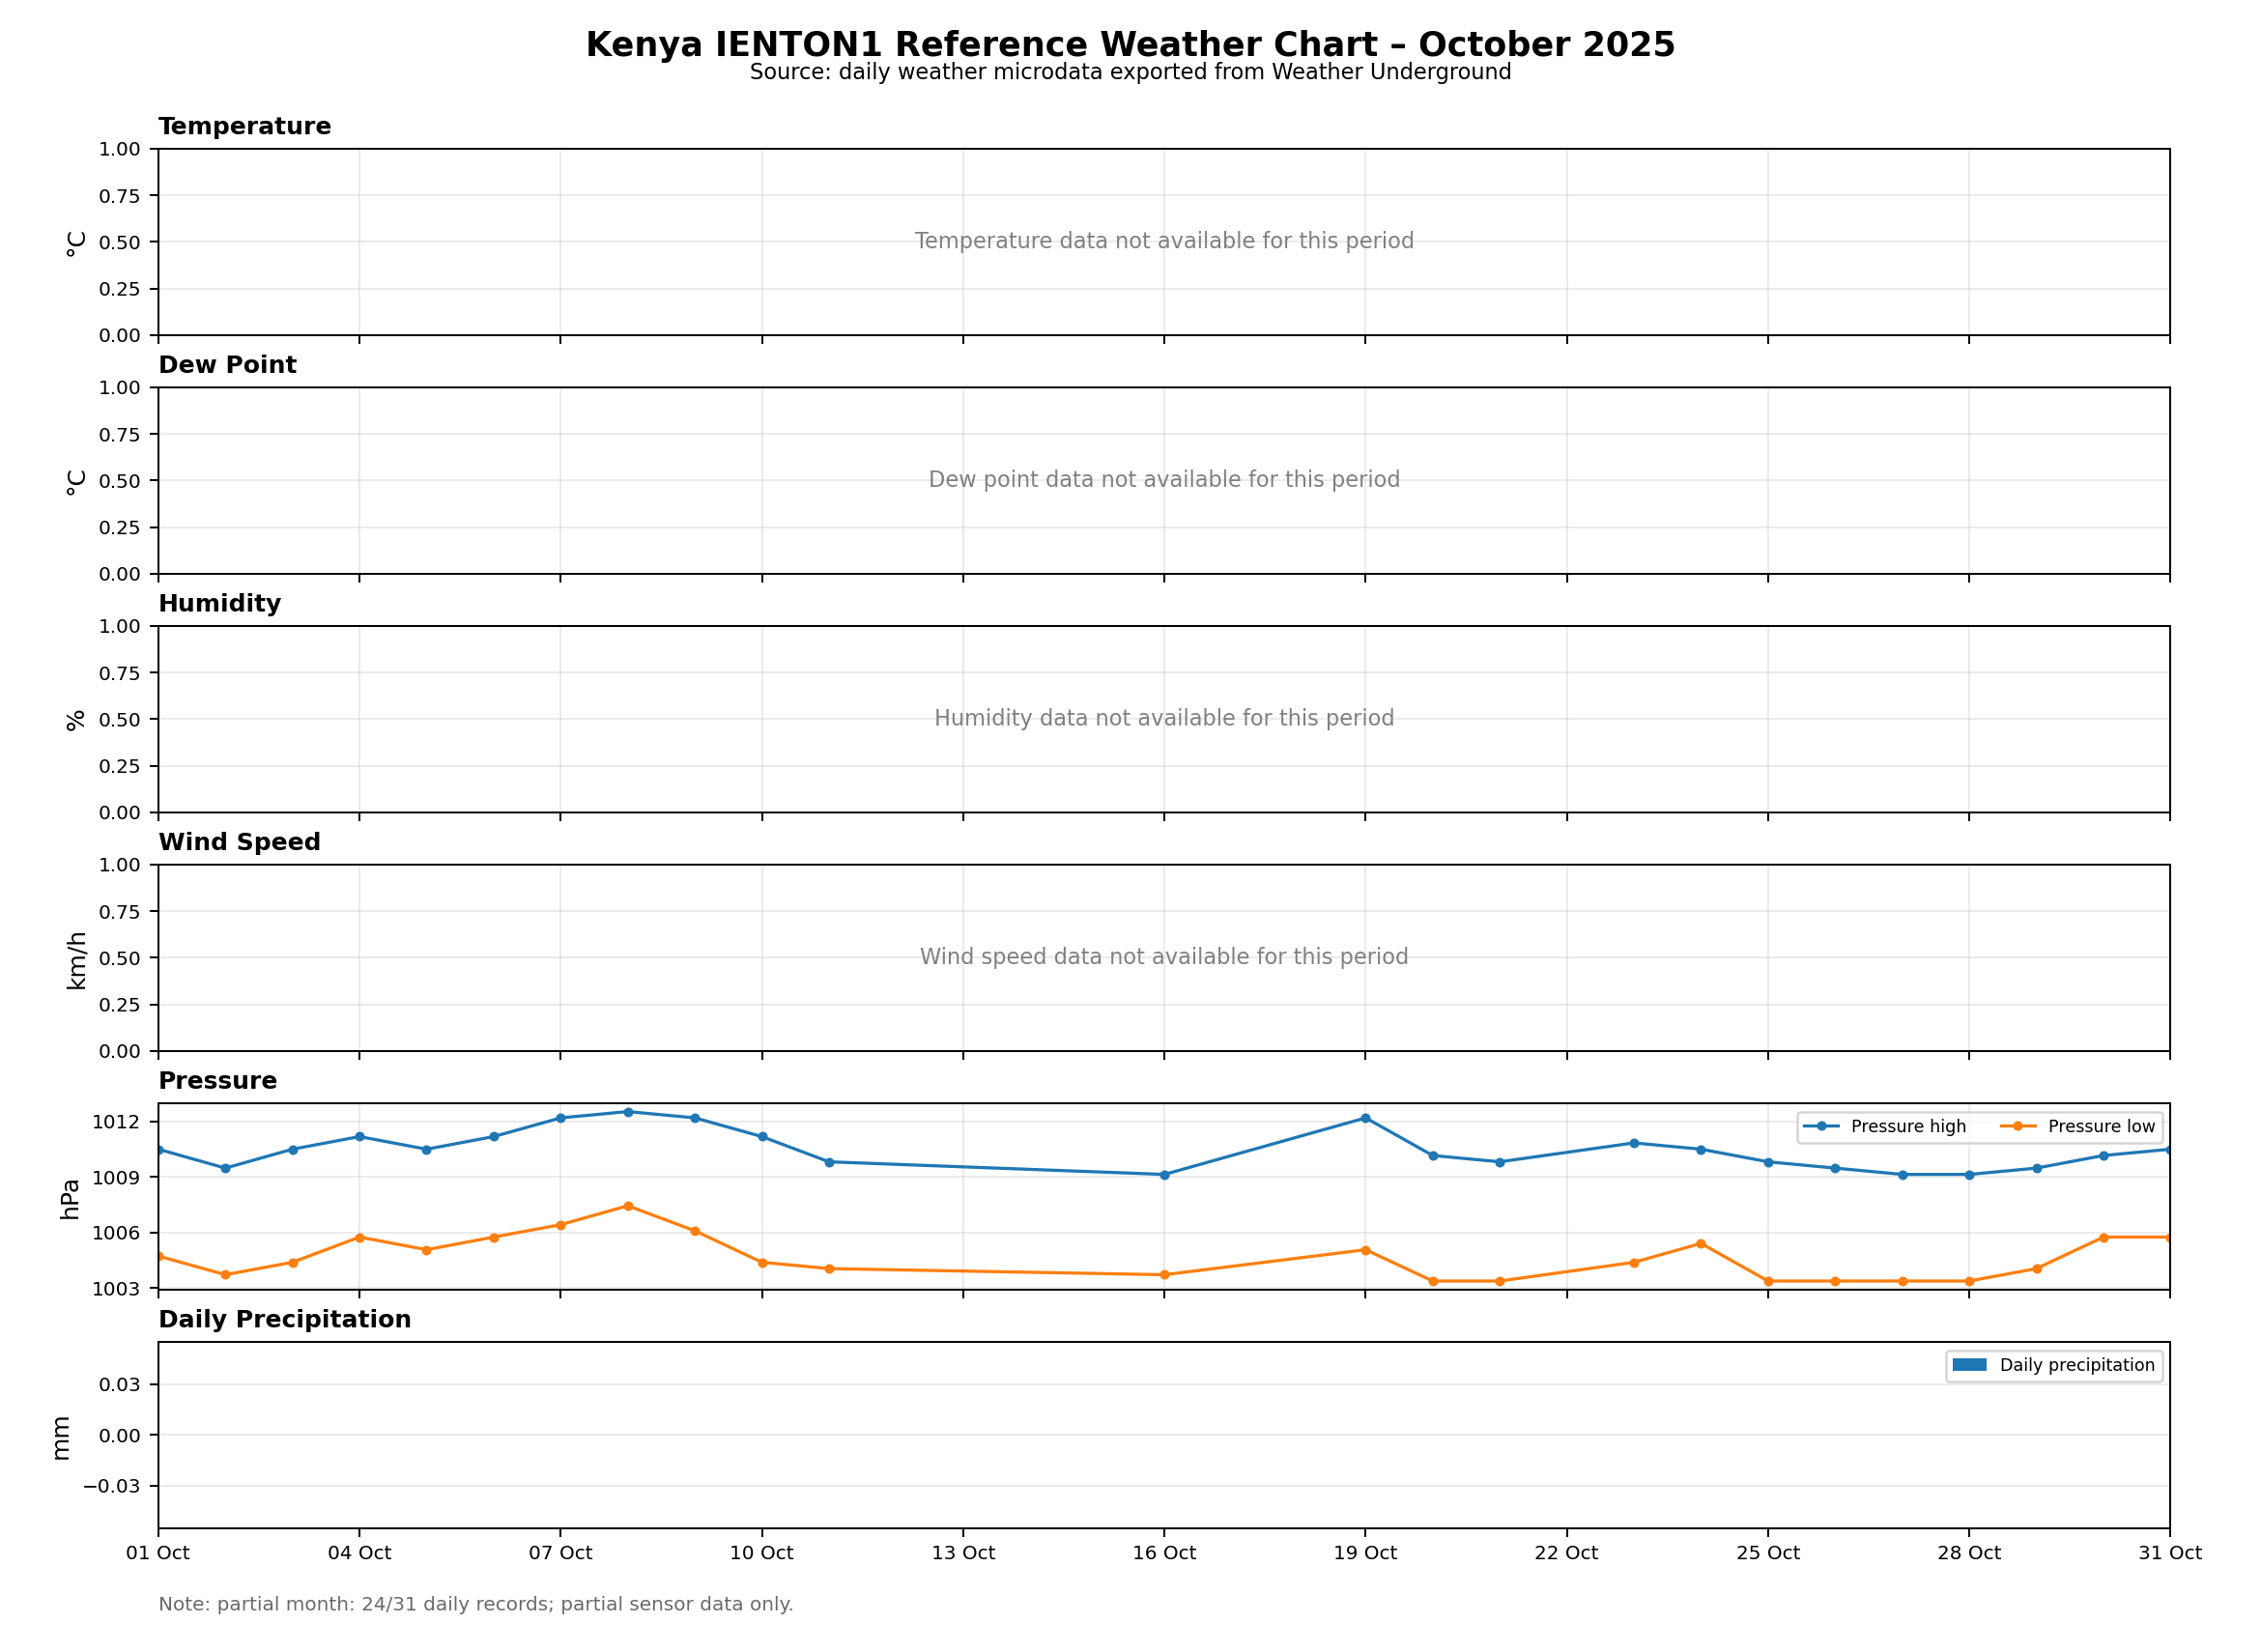 October 2025
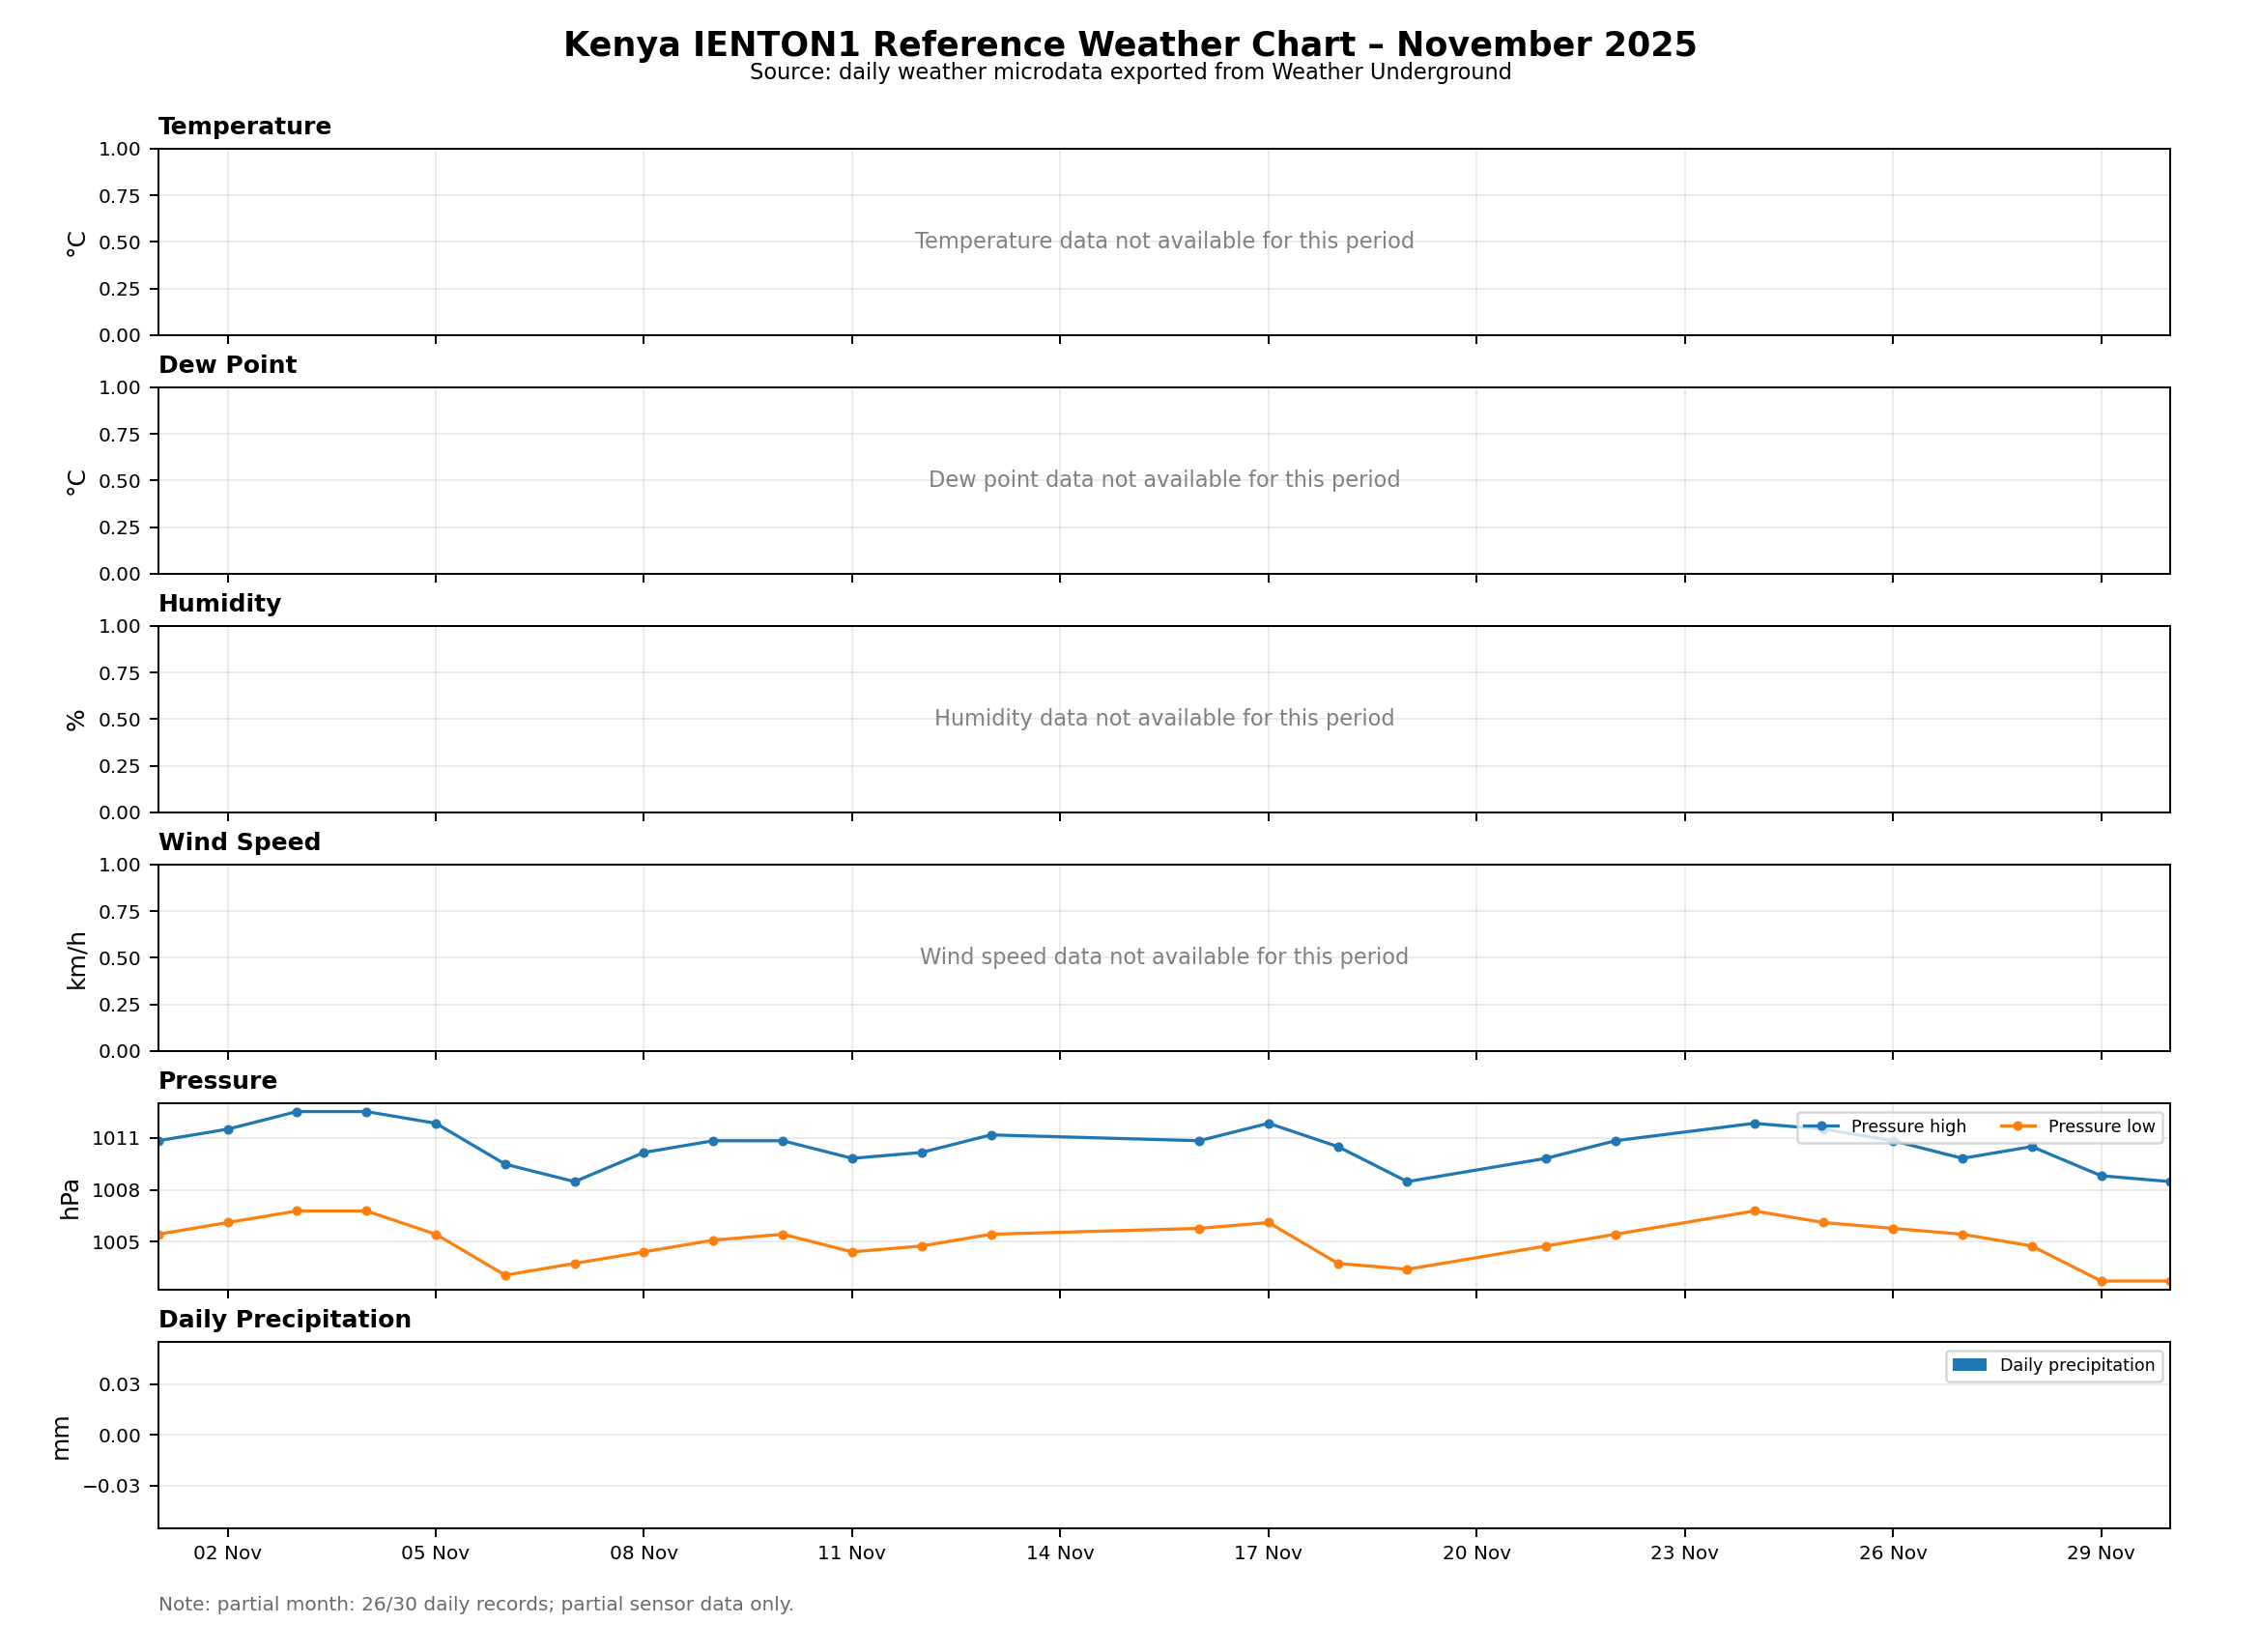 November 2025
 December 2025
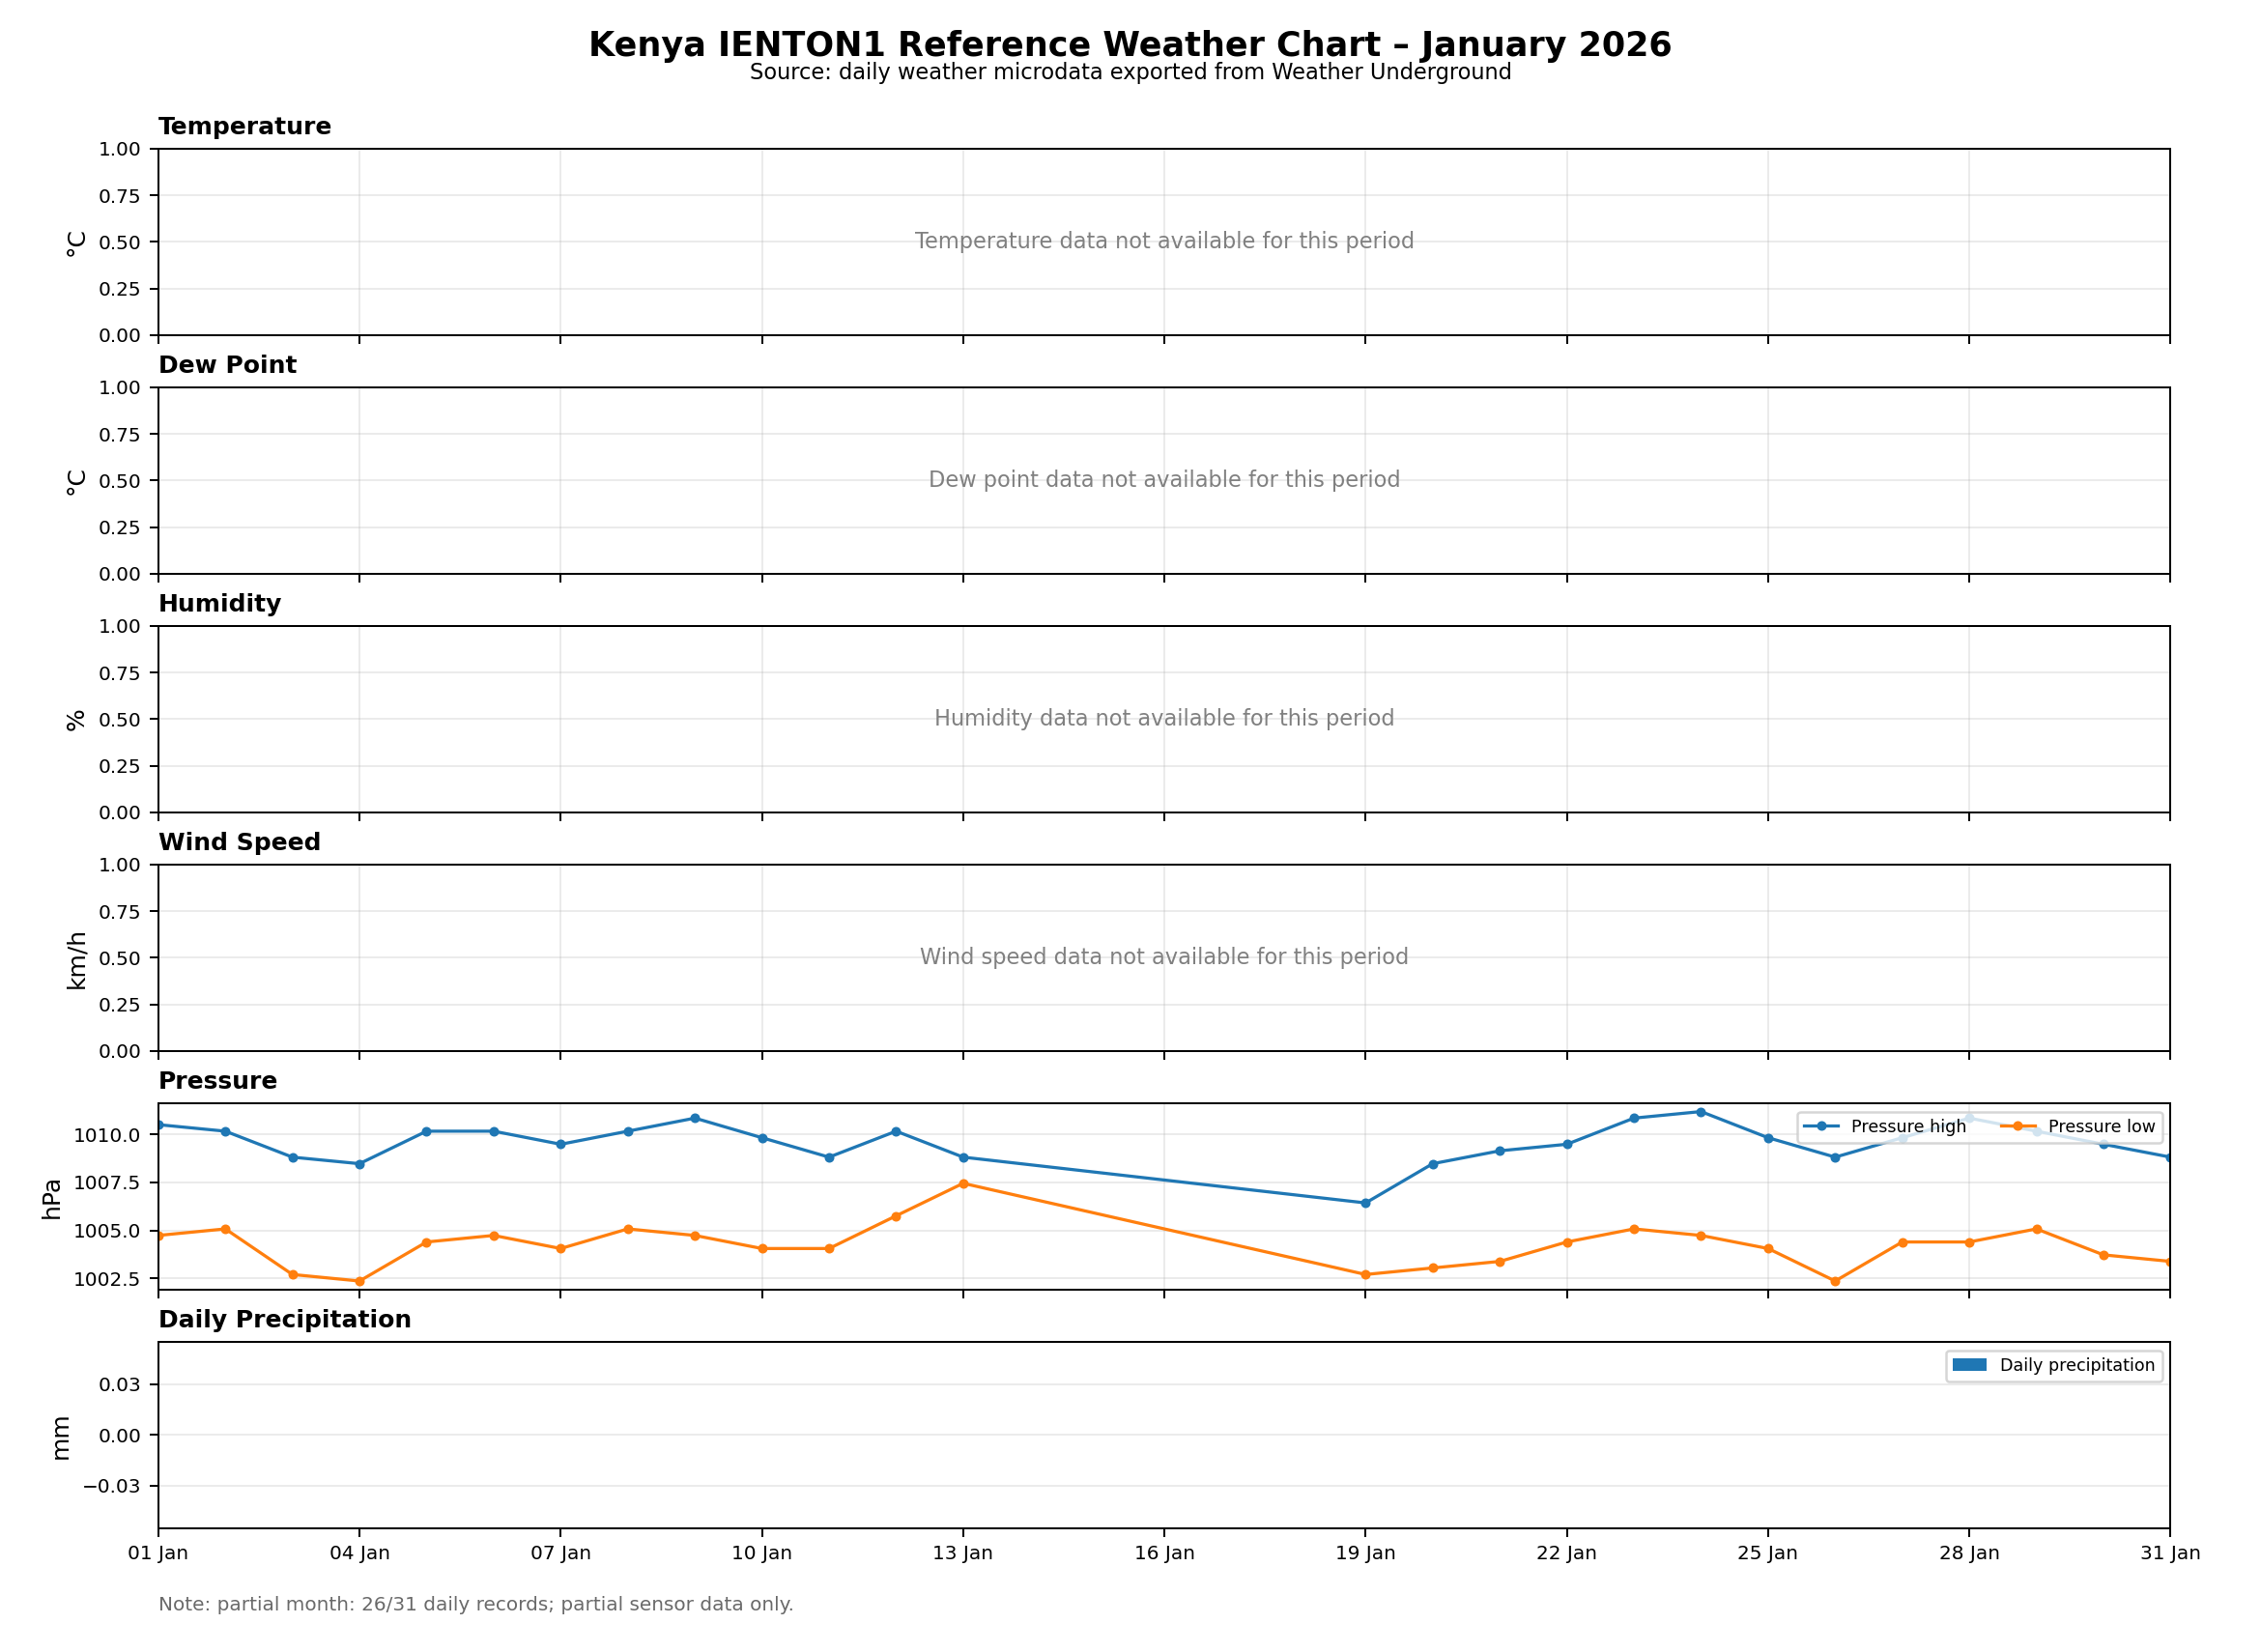 January 2026
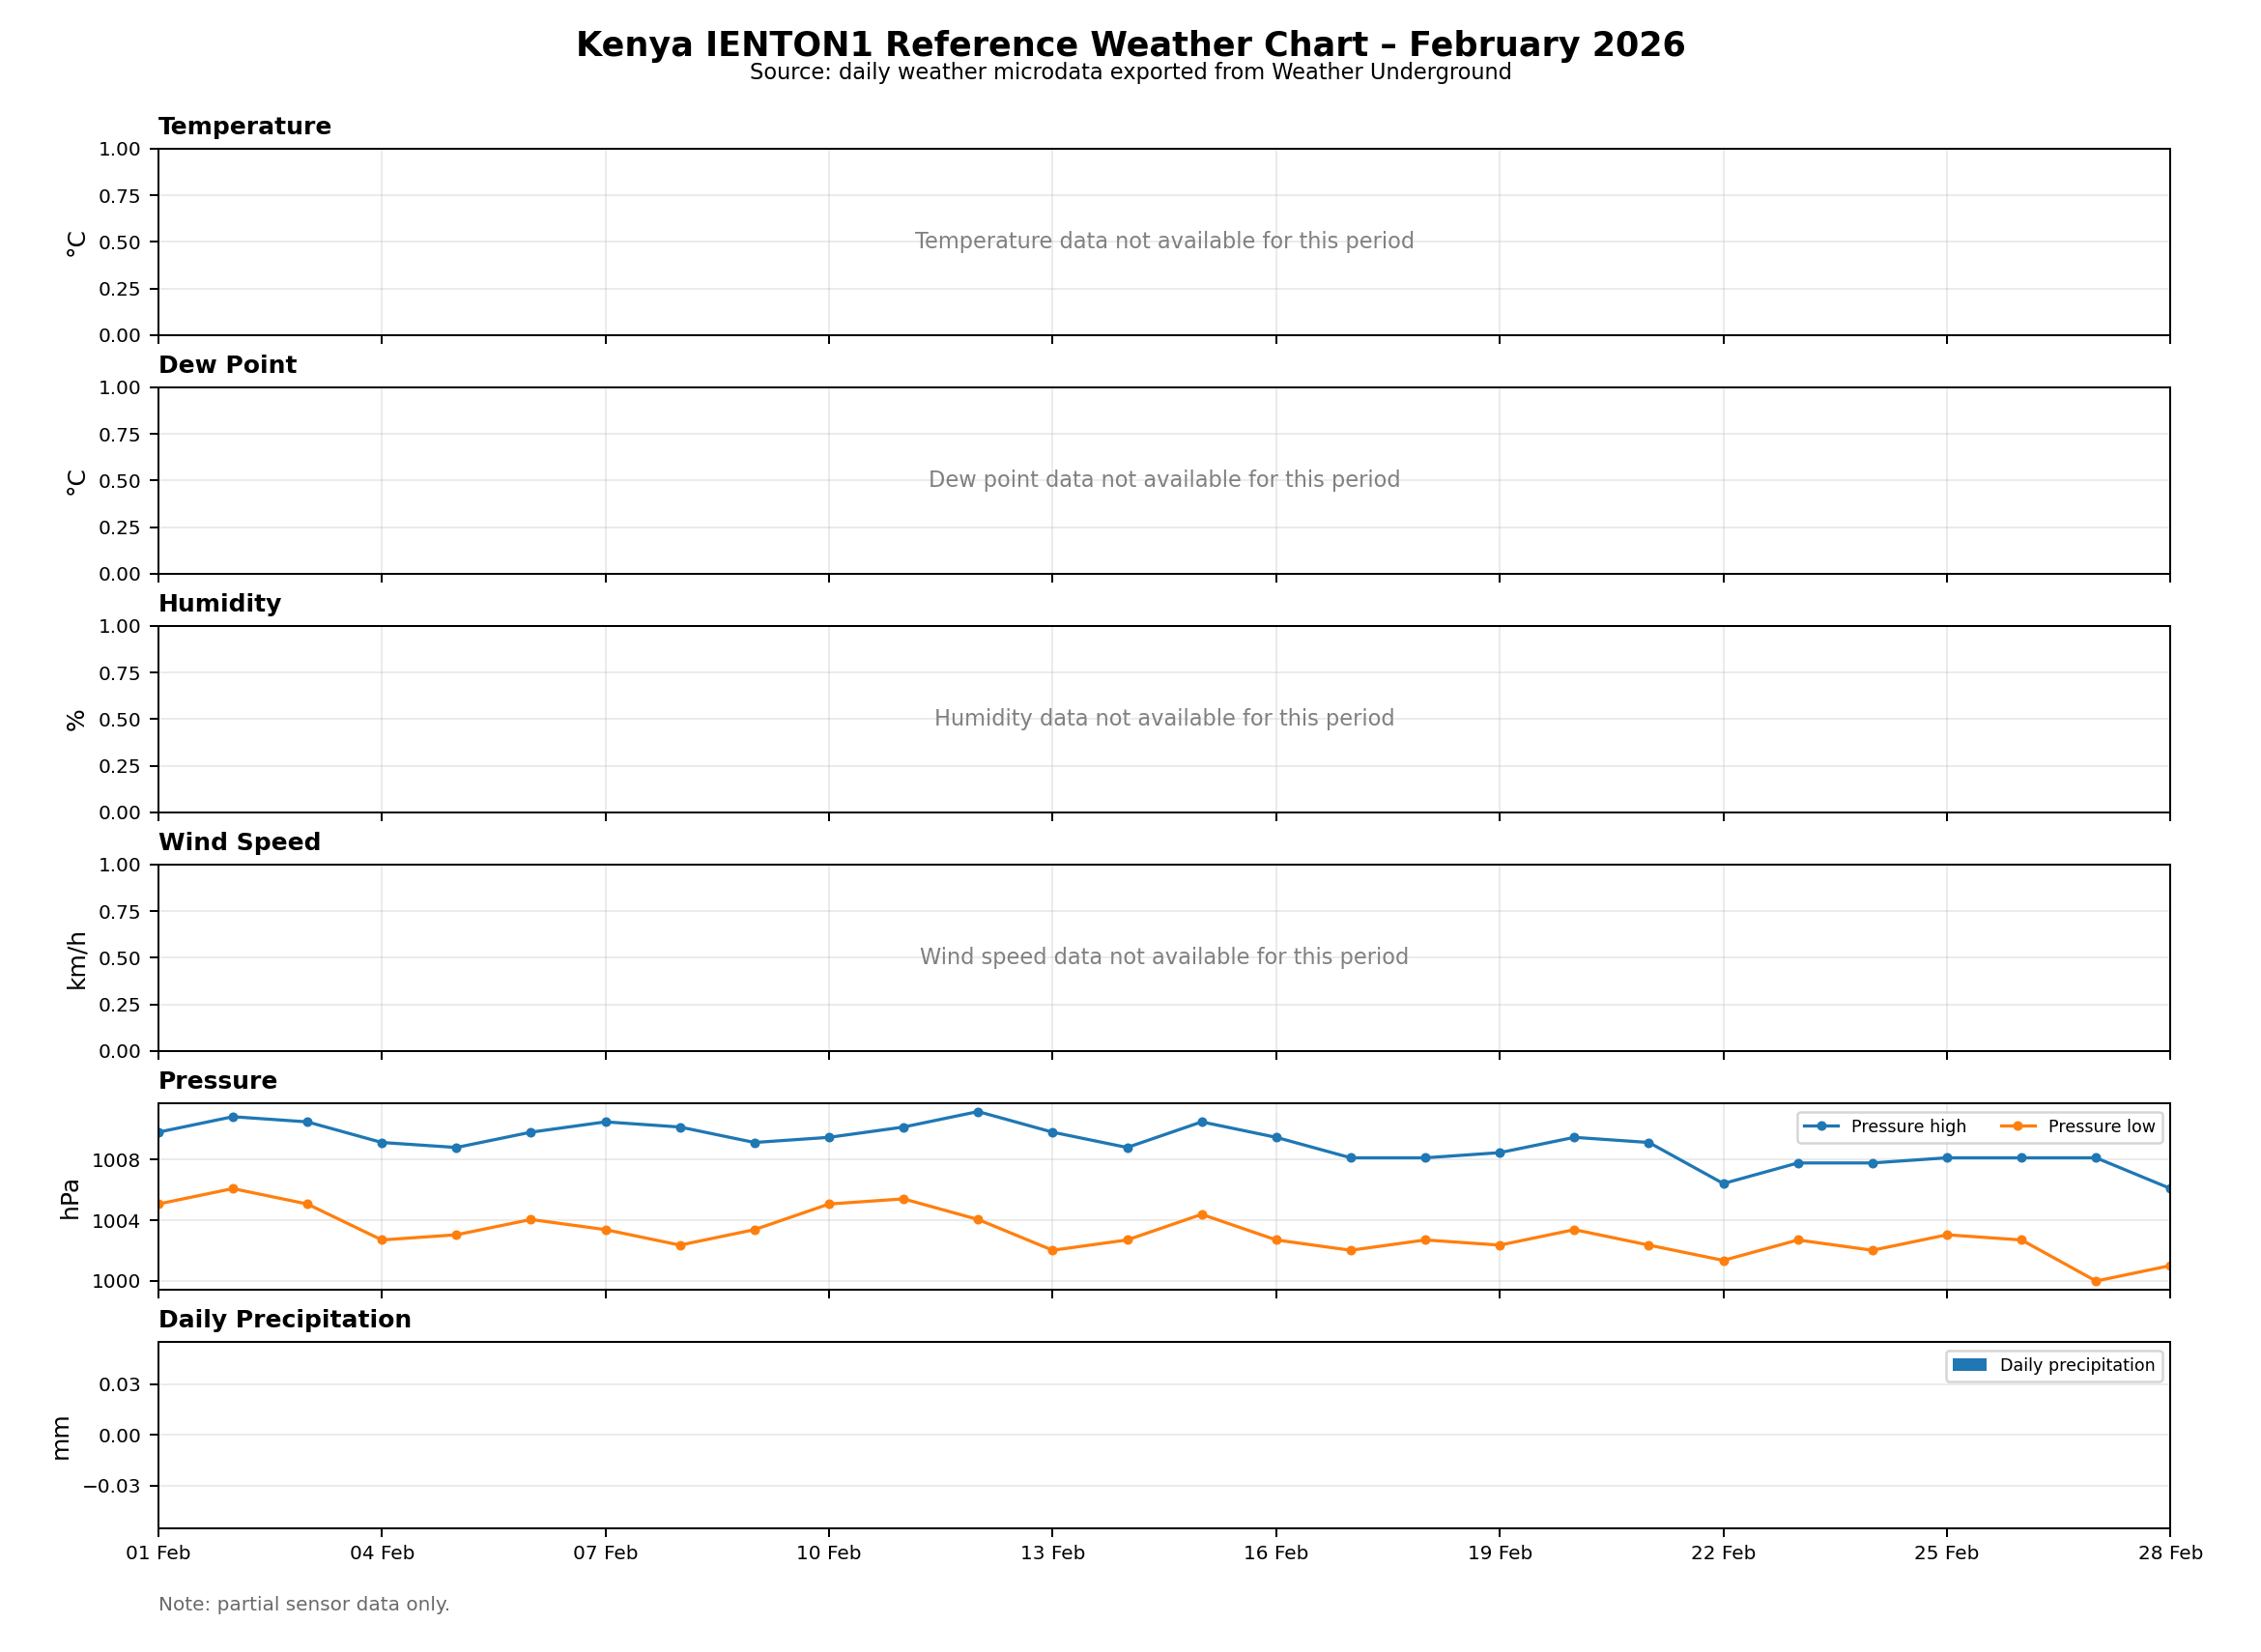 February 2026
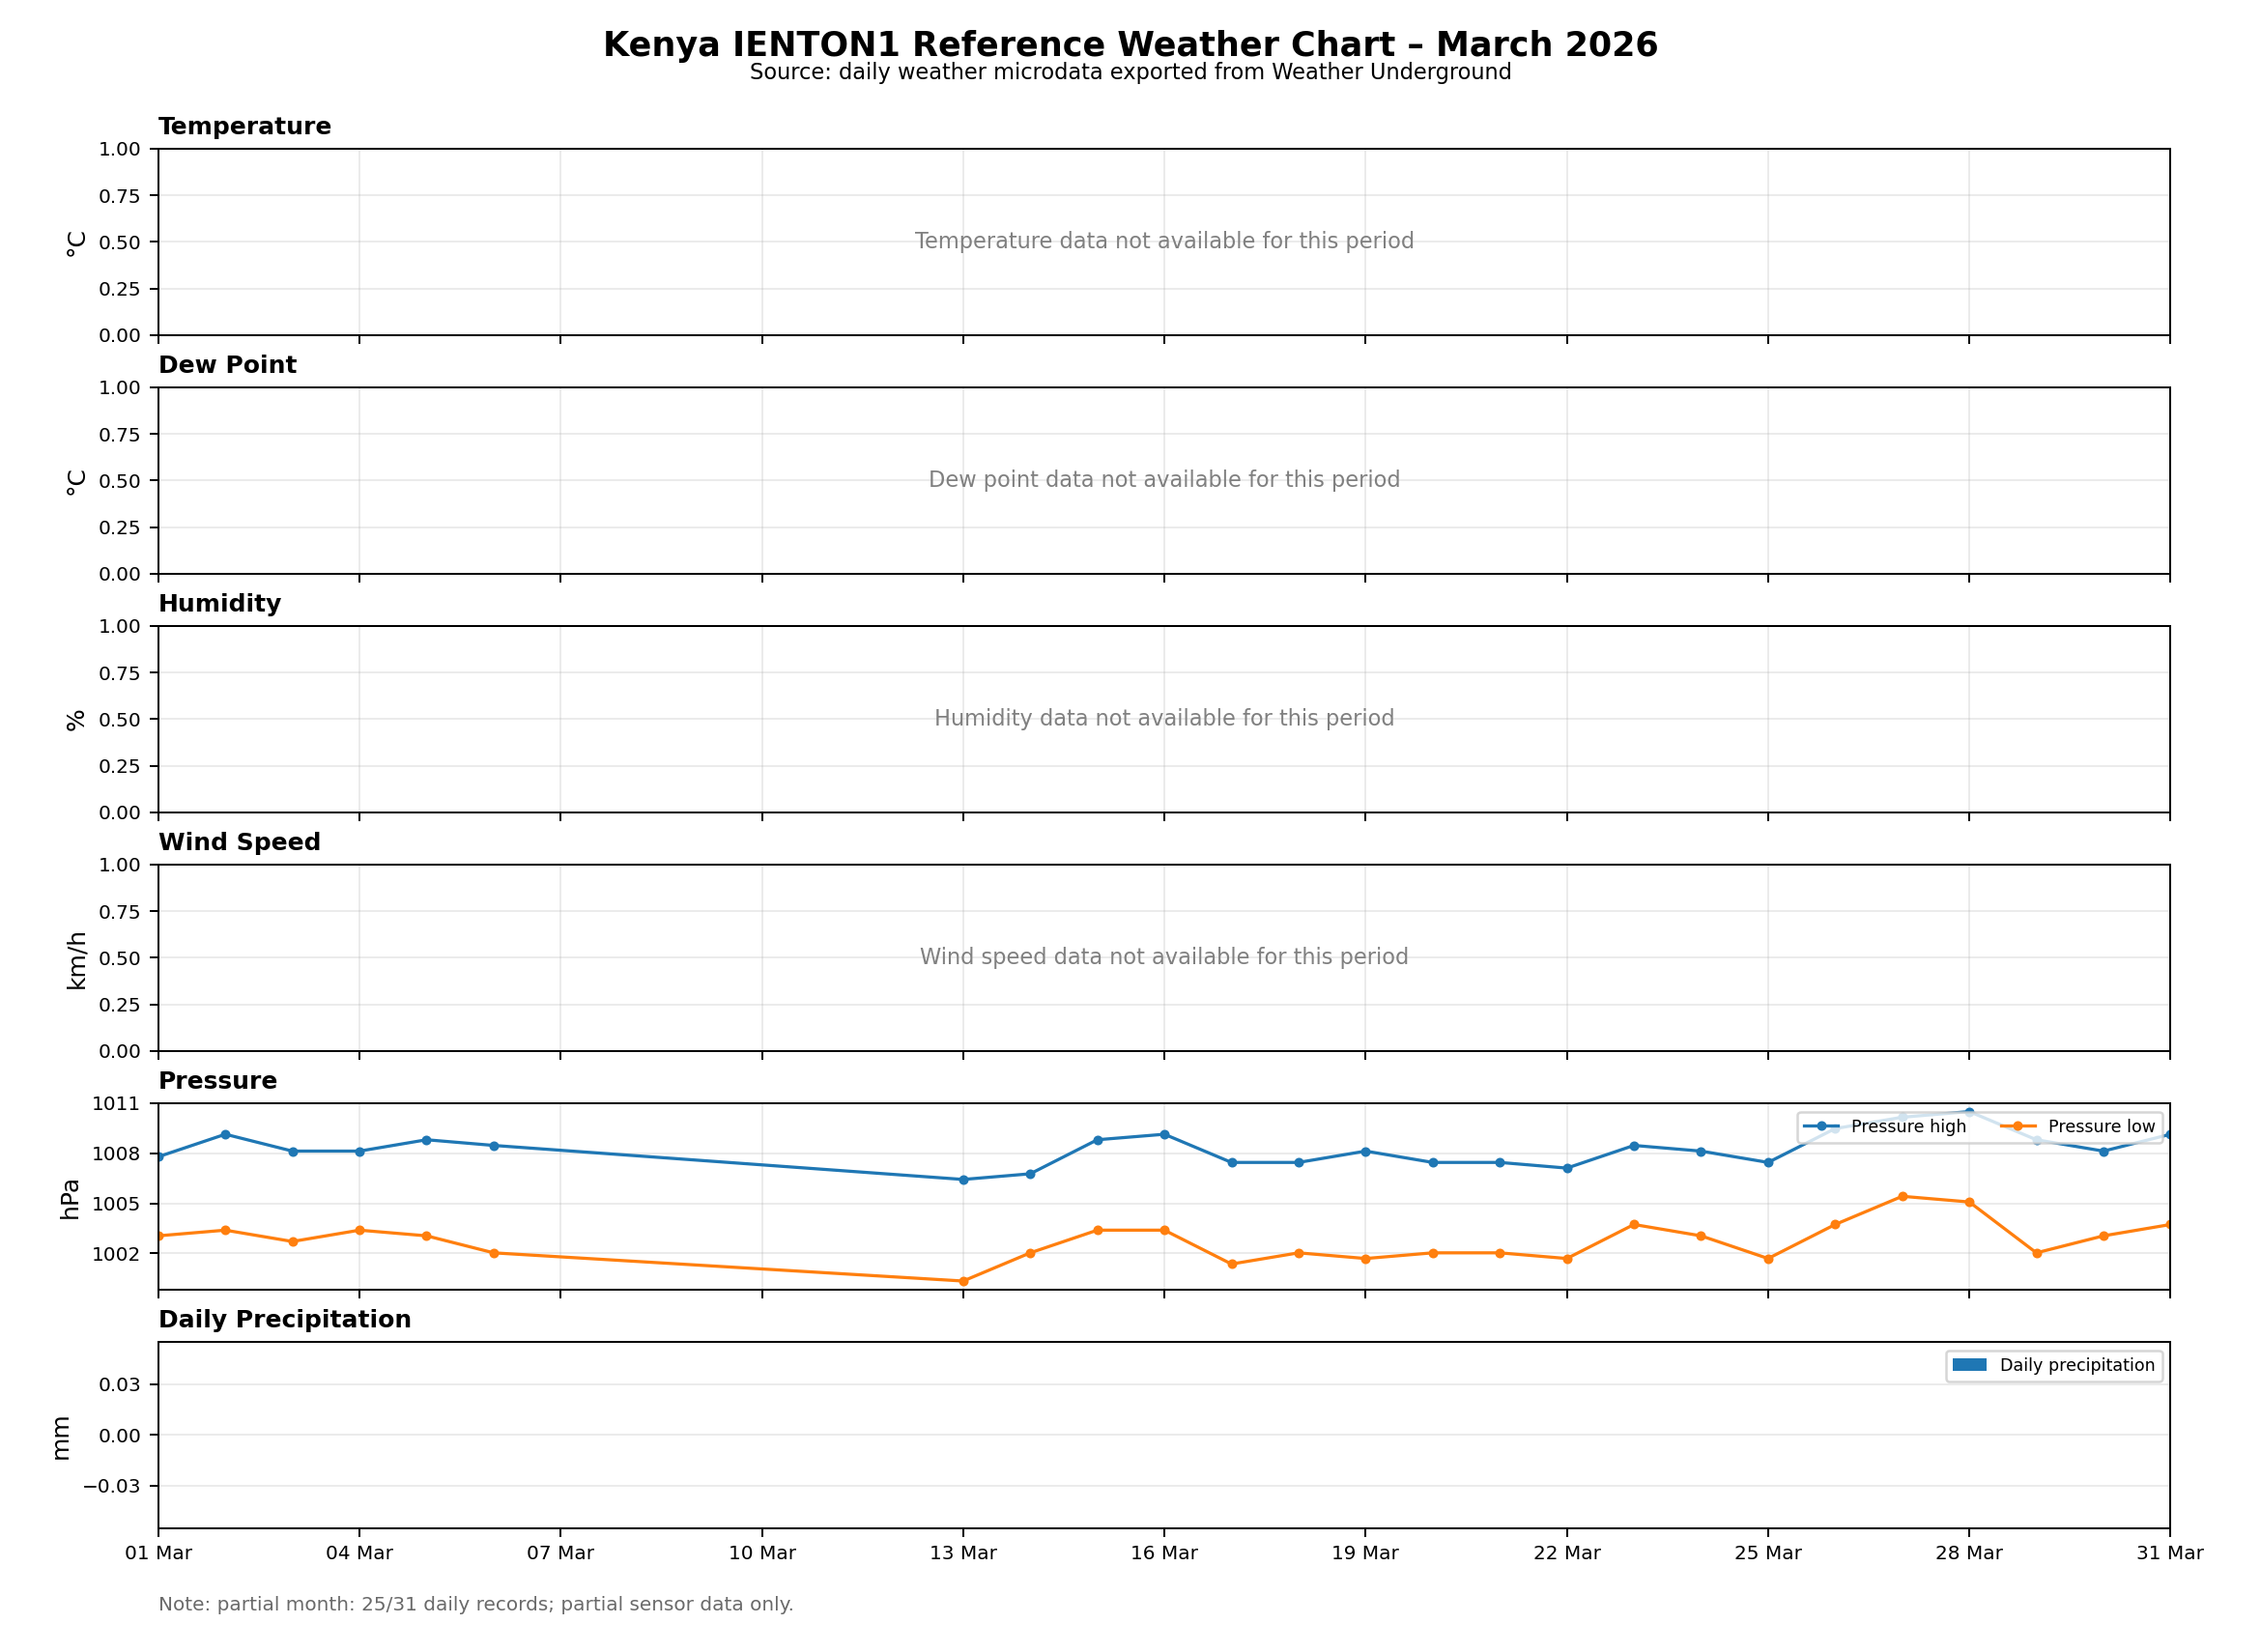 March 2026
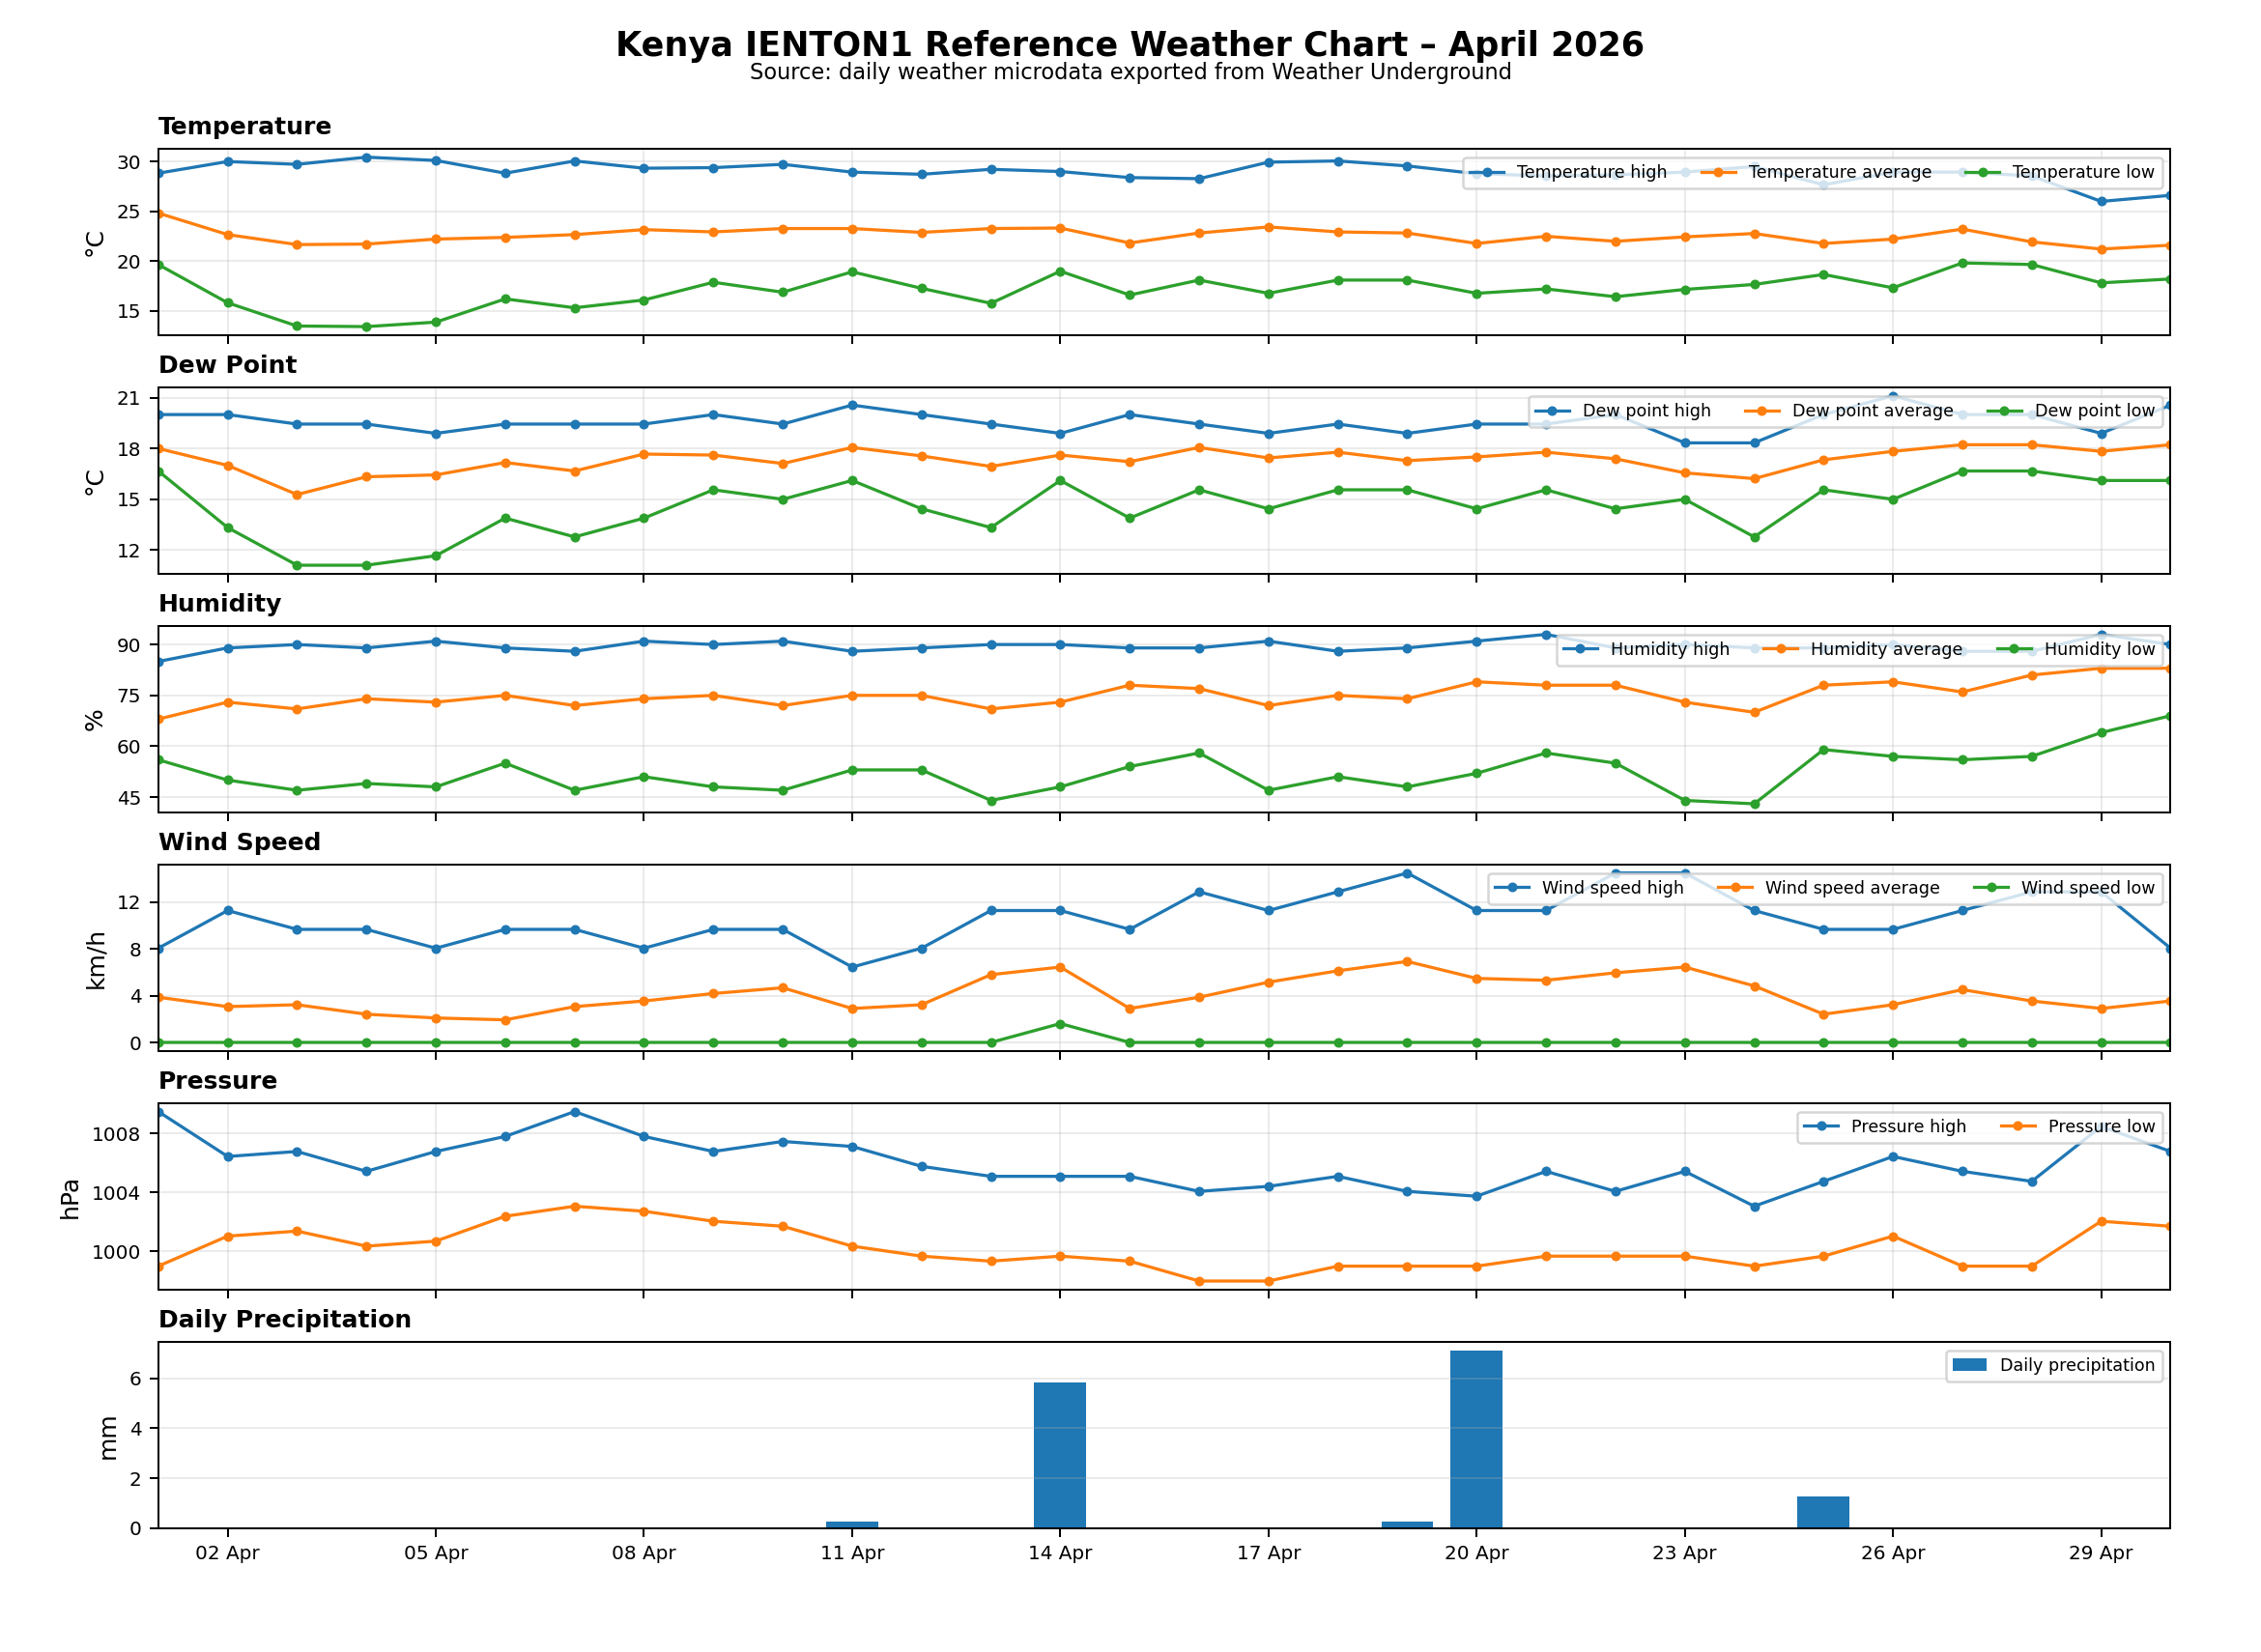 April 2026
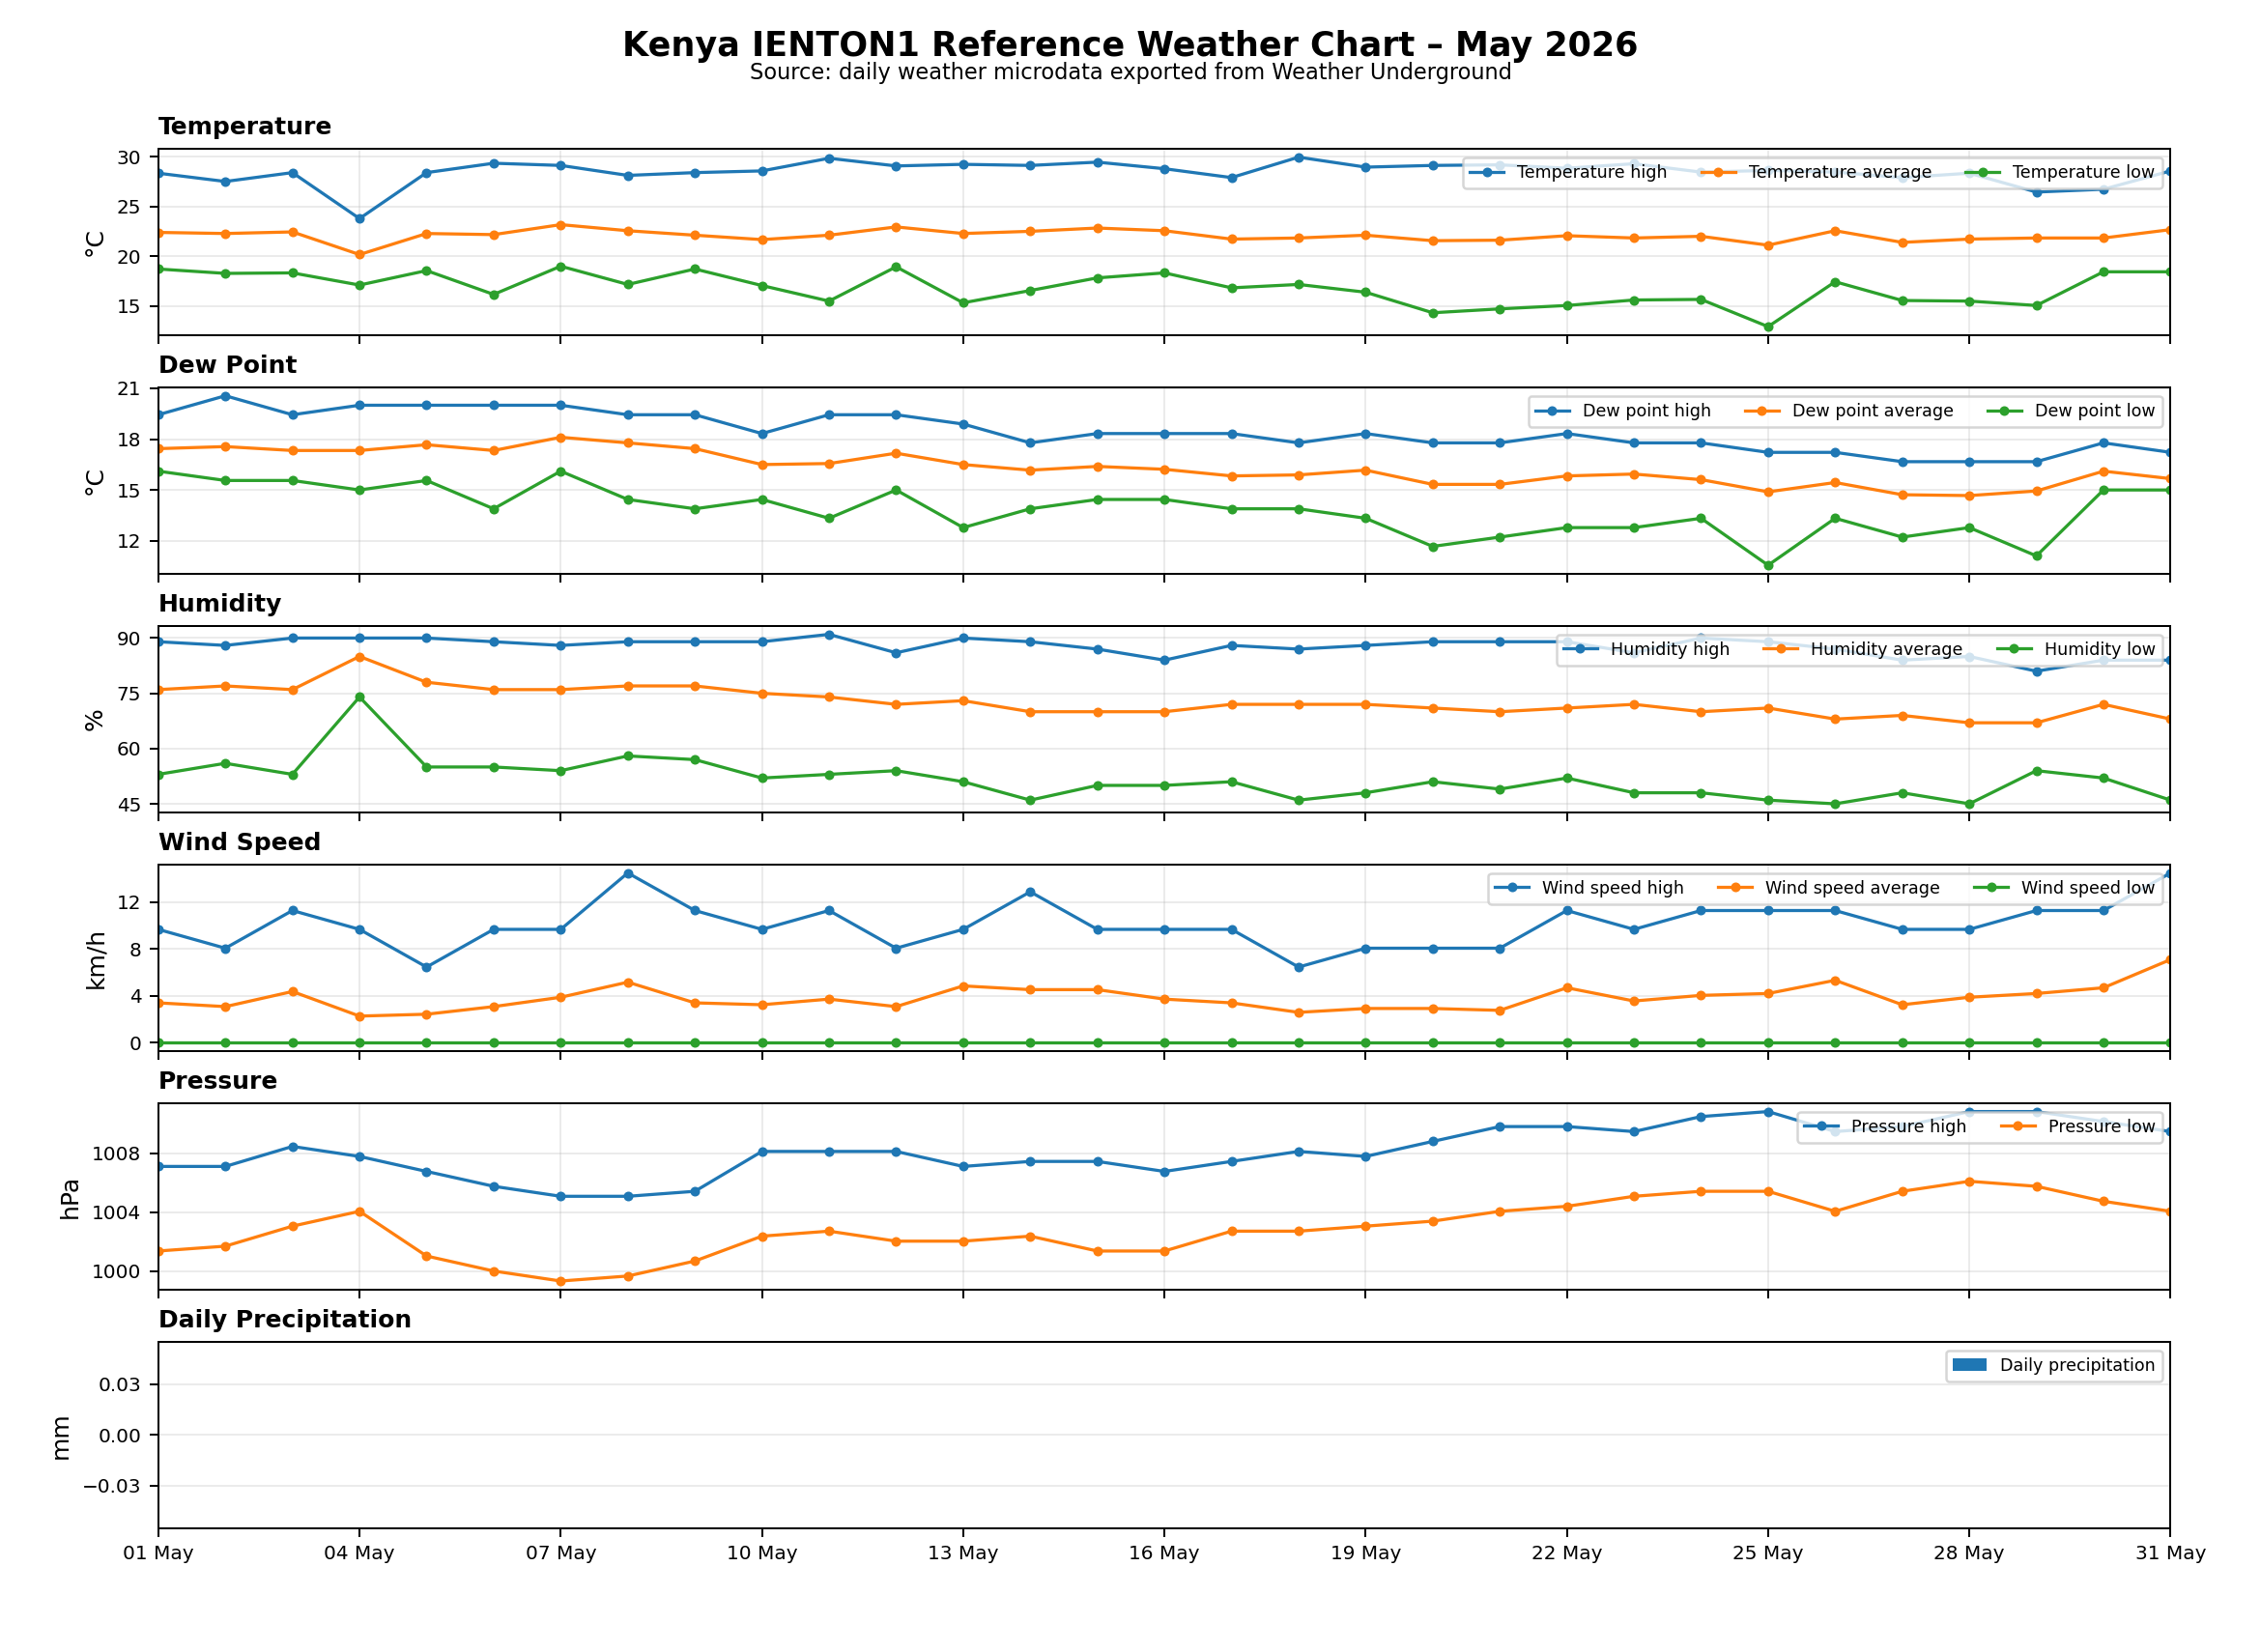 May 2026
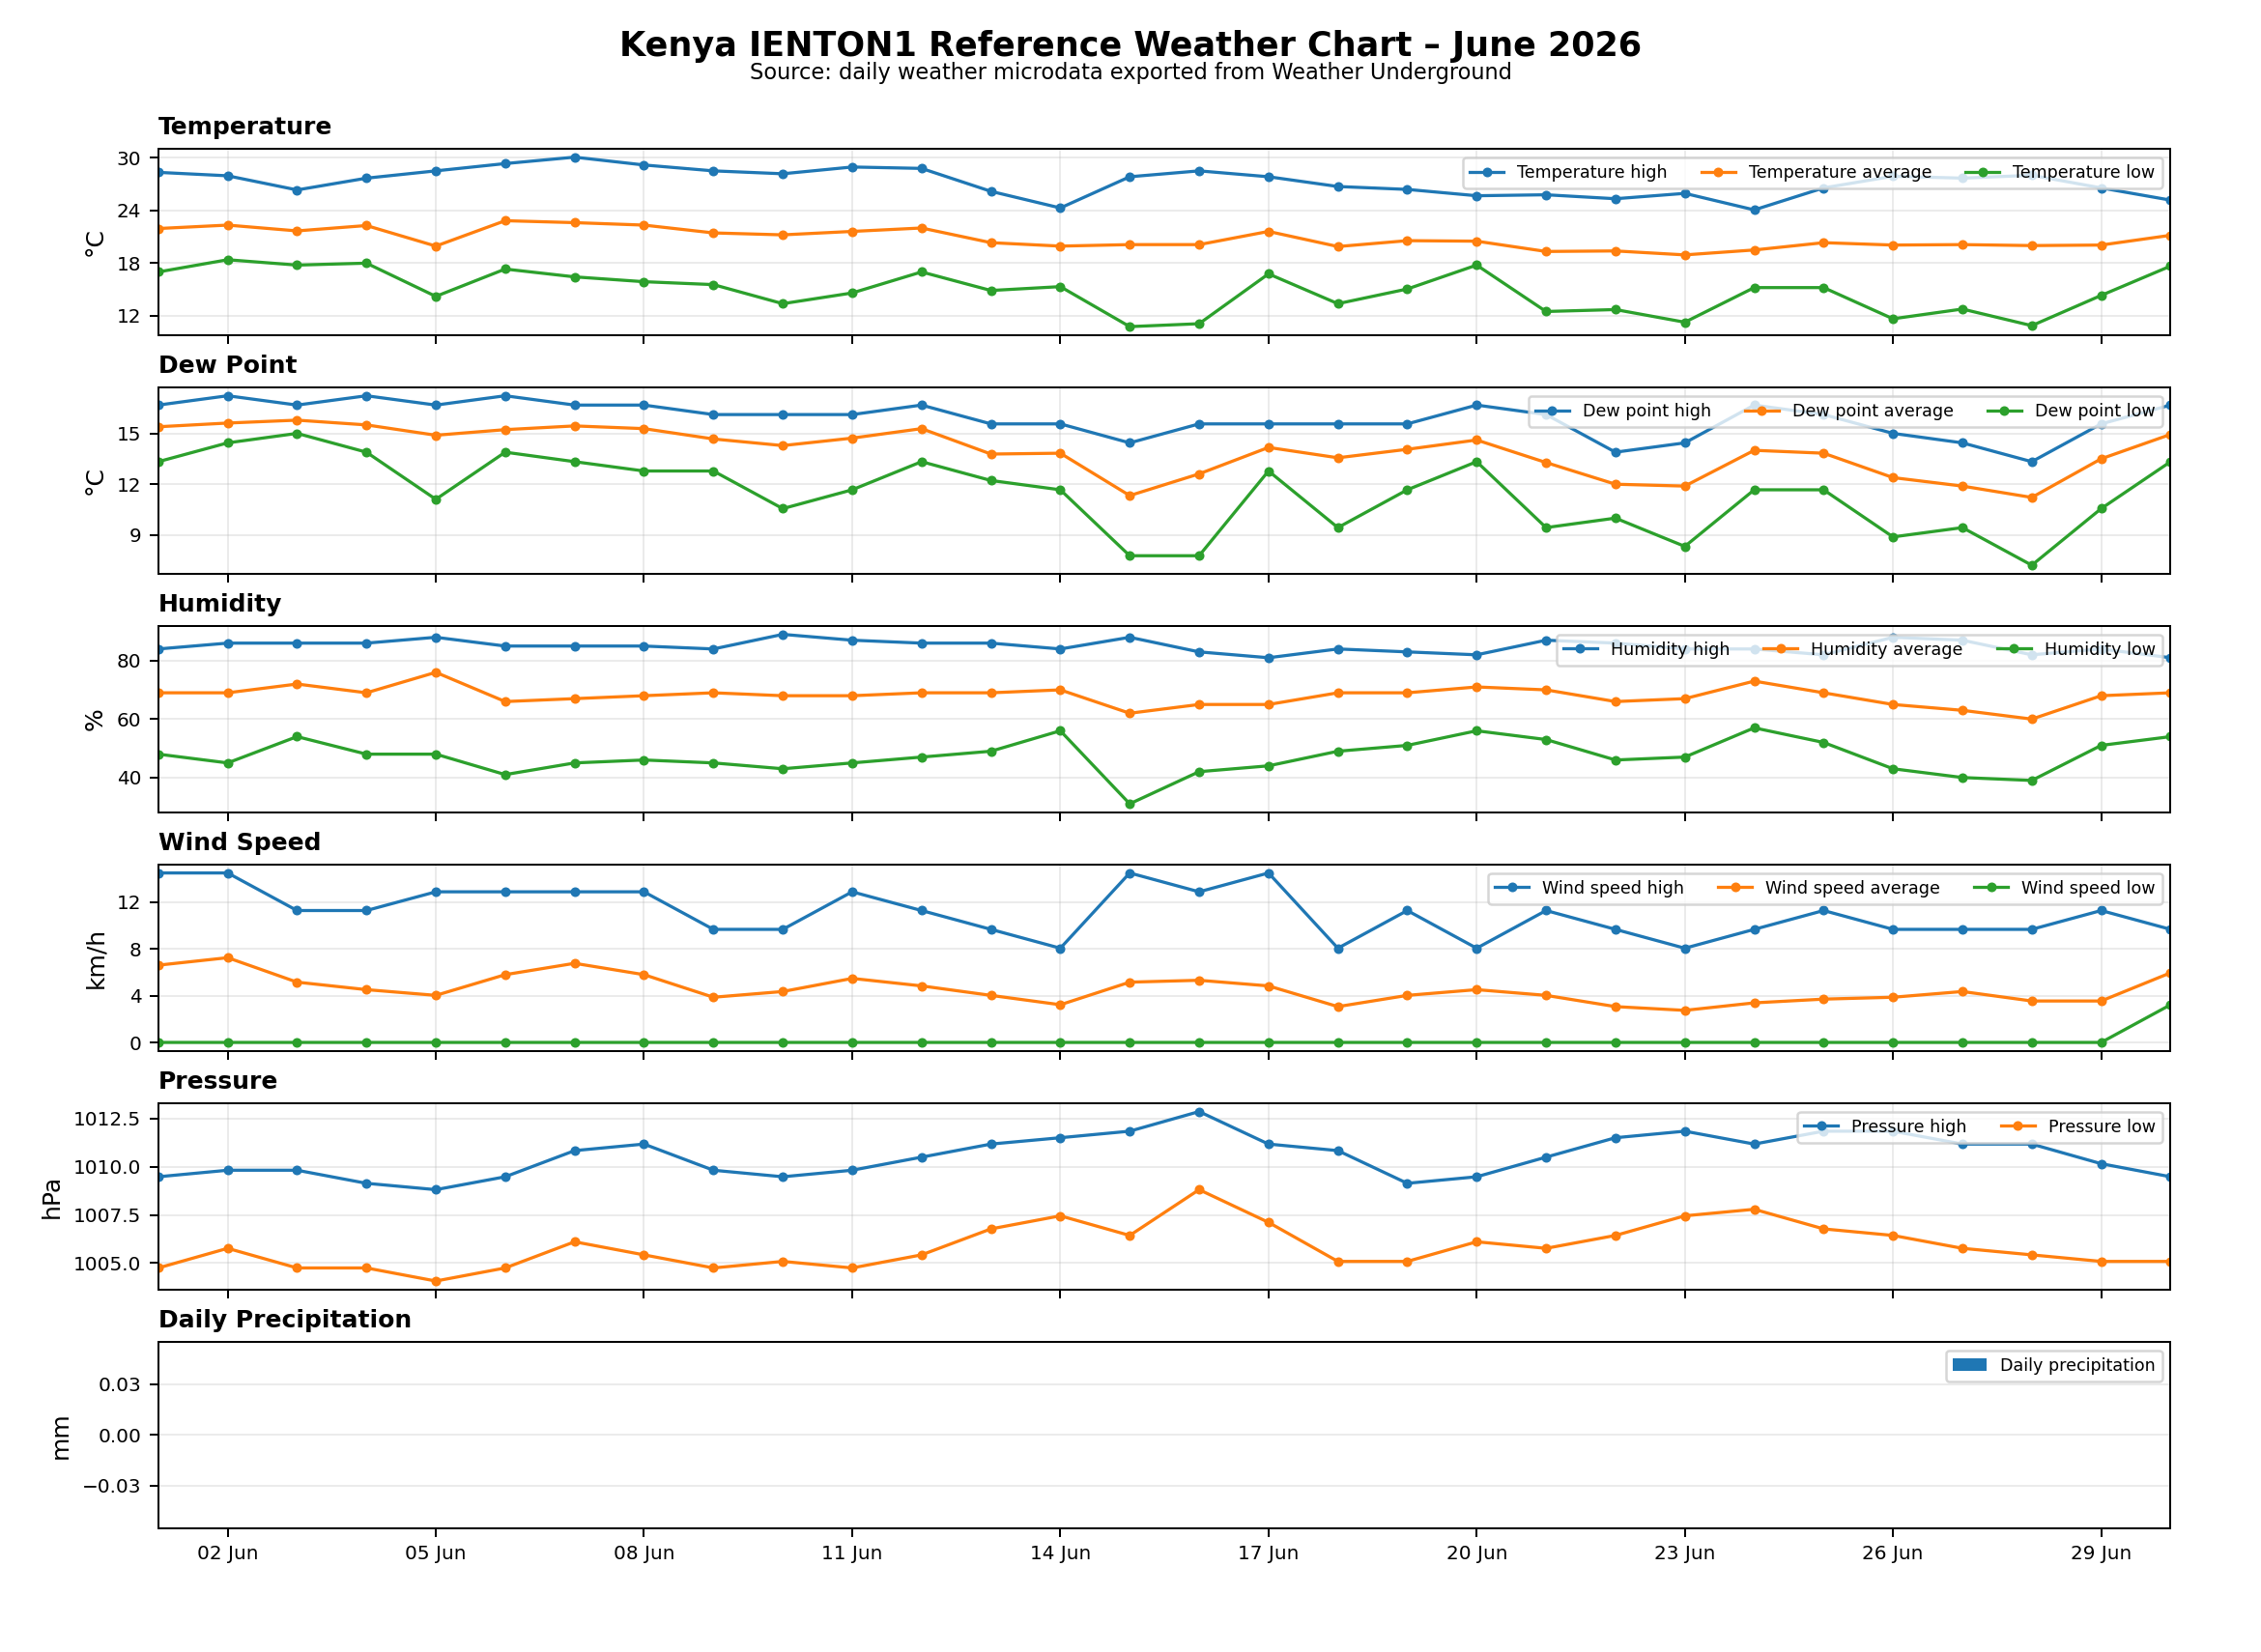 June 2026
A structured dashboard of short recorded monitoring feeds and grouped visual records from the Kenya experimental field.
Downloadable weather microdata are available for the IENTON1 nearby reference weather station in the Loitokitok area.
Kenya microdata XLSX IENTON1 reference CSV Kenya complete ZIPDownloadable datasets are organised by country, station and monitoring period in CSV, XLSX and ZIP format, using available daily weather-station records.
Available datasets may include date, temperature high / average / low, dew point high / average / low, humidity high / average / low, wind speed high / average / low, pressure high / low and precipitation sum.
Quick download cards below provide direct access to the main dataset package for each country.
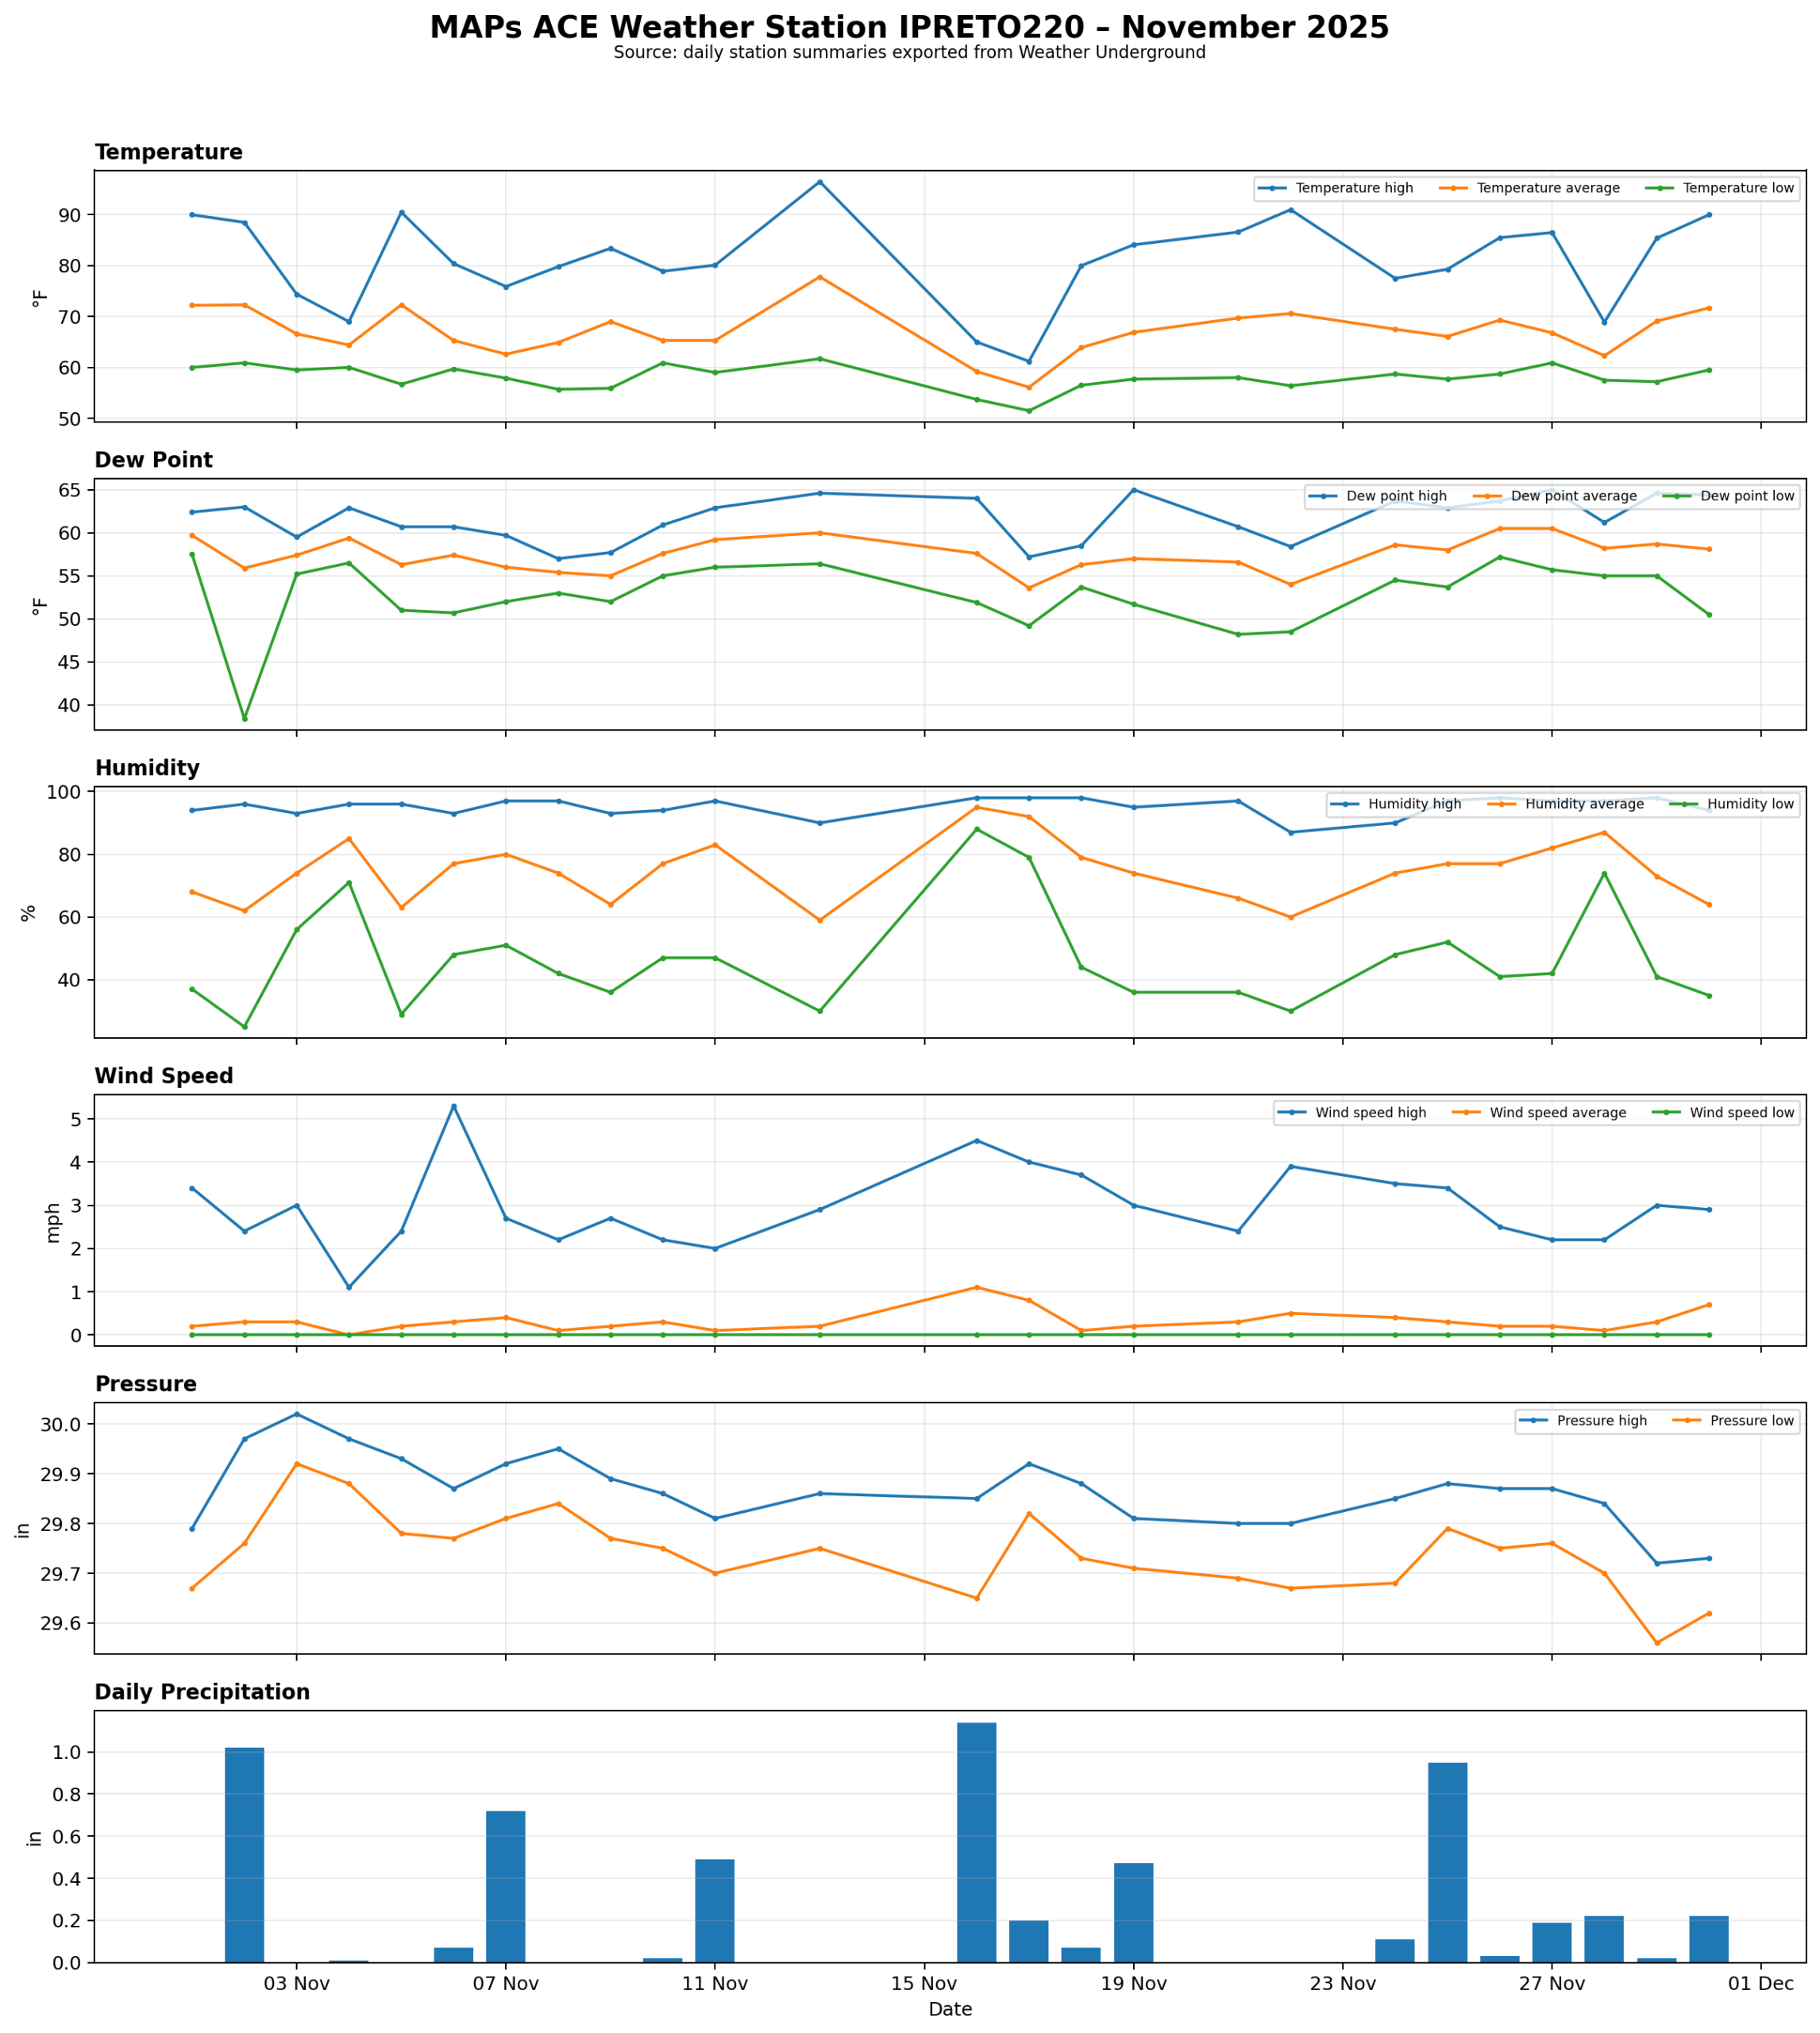 November 2025
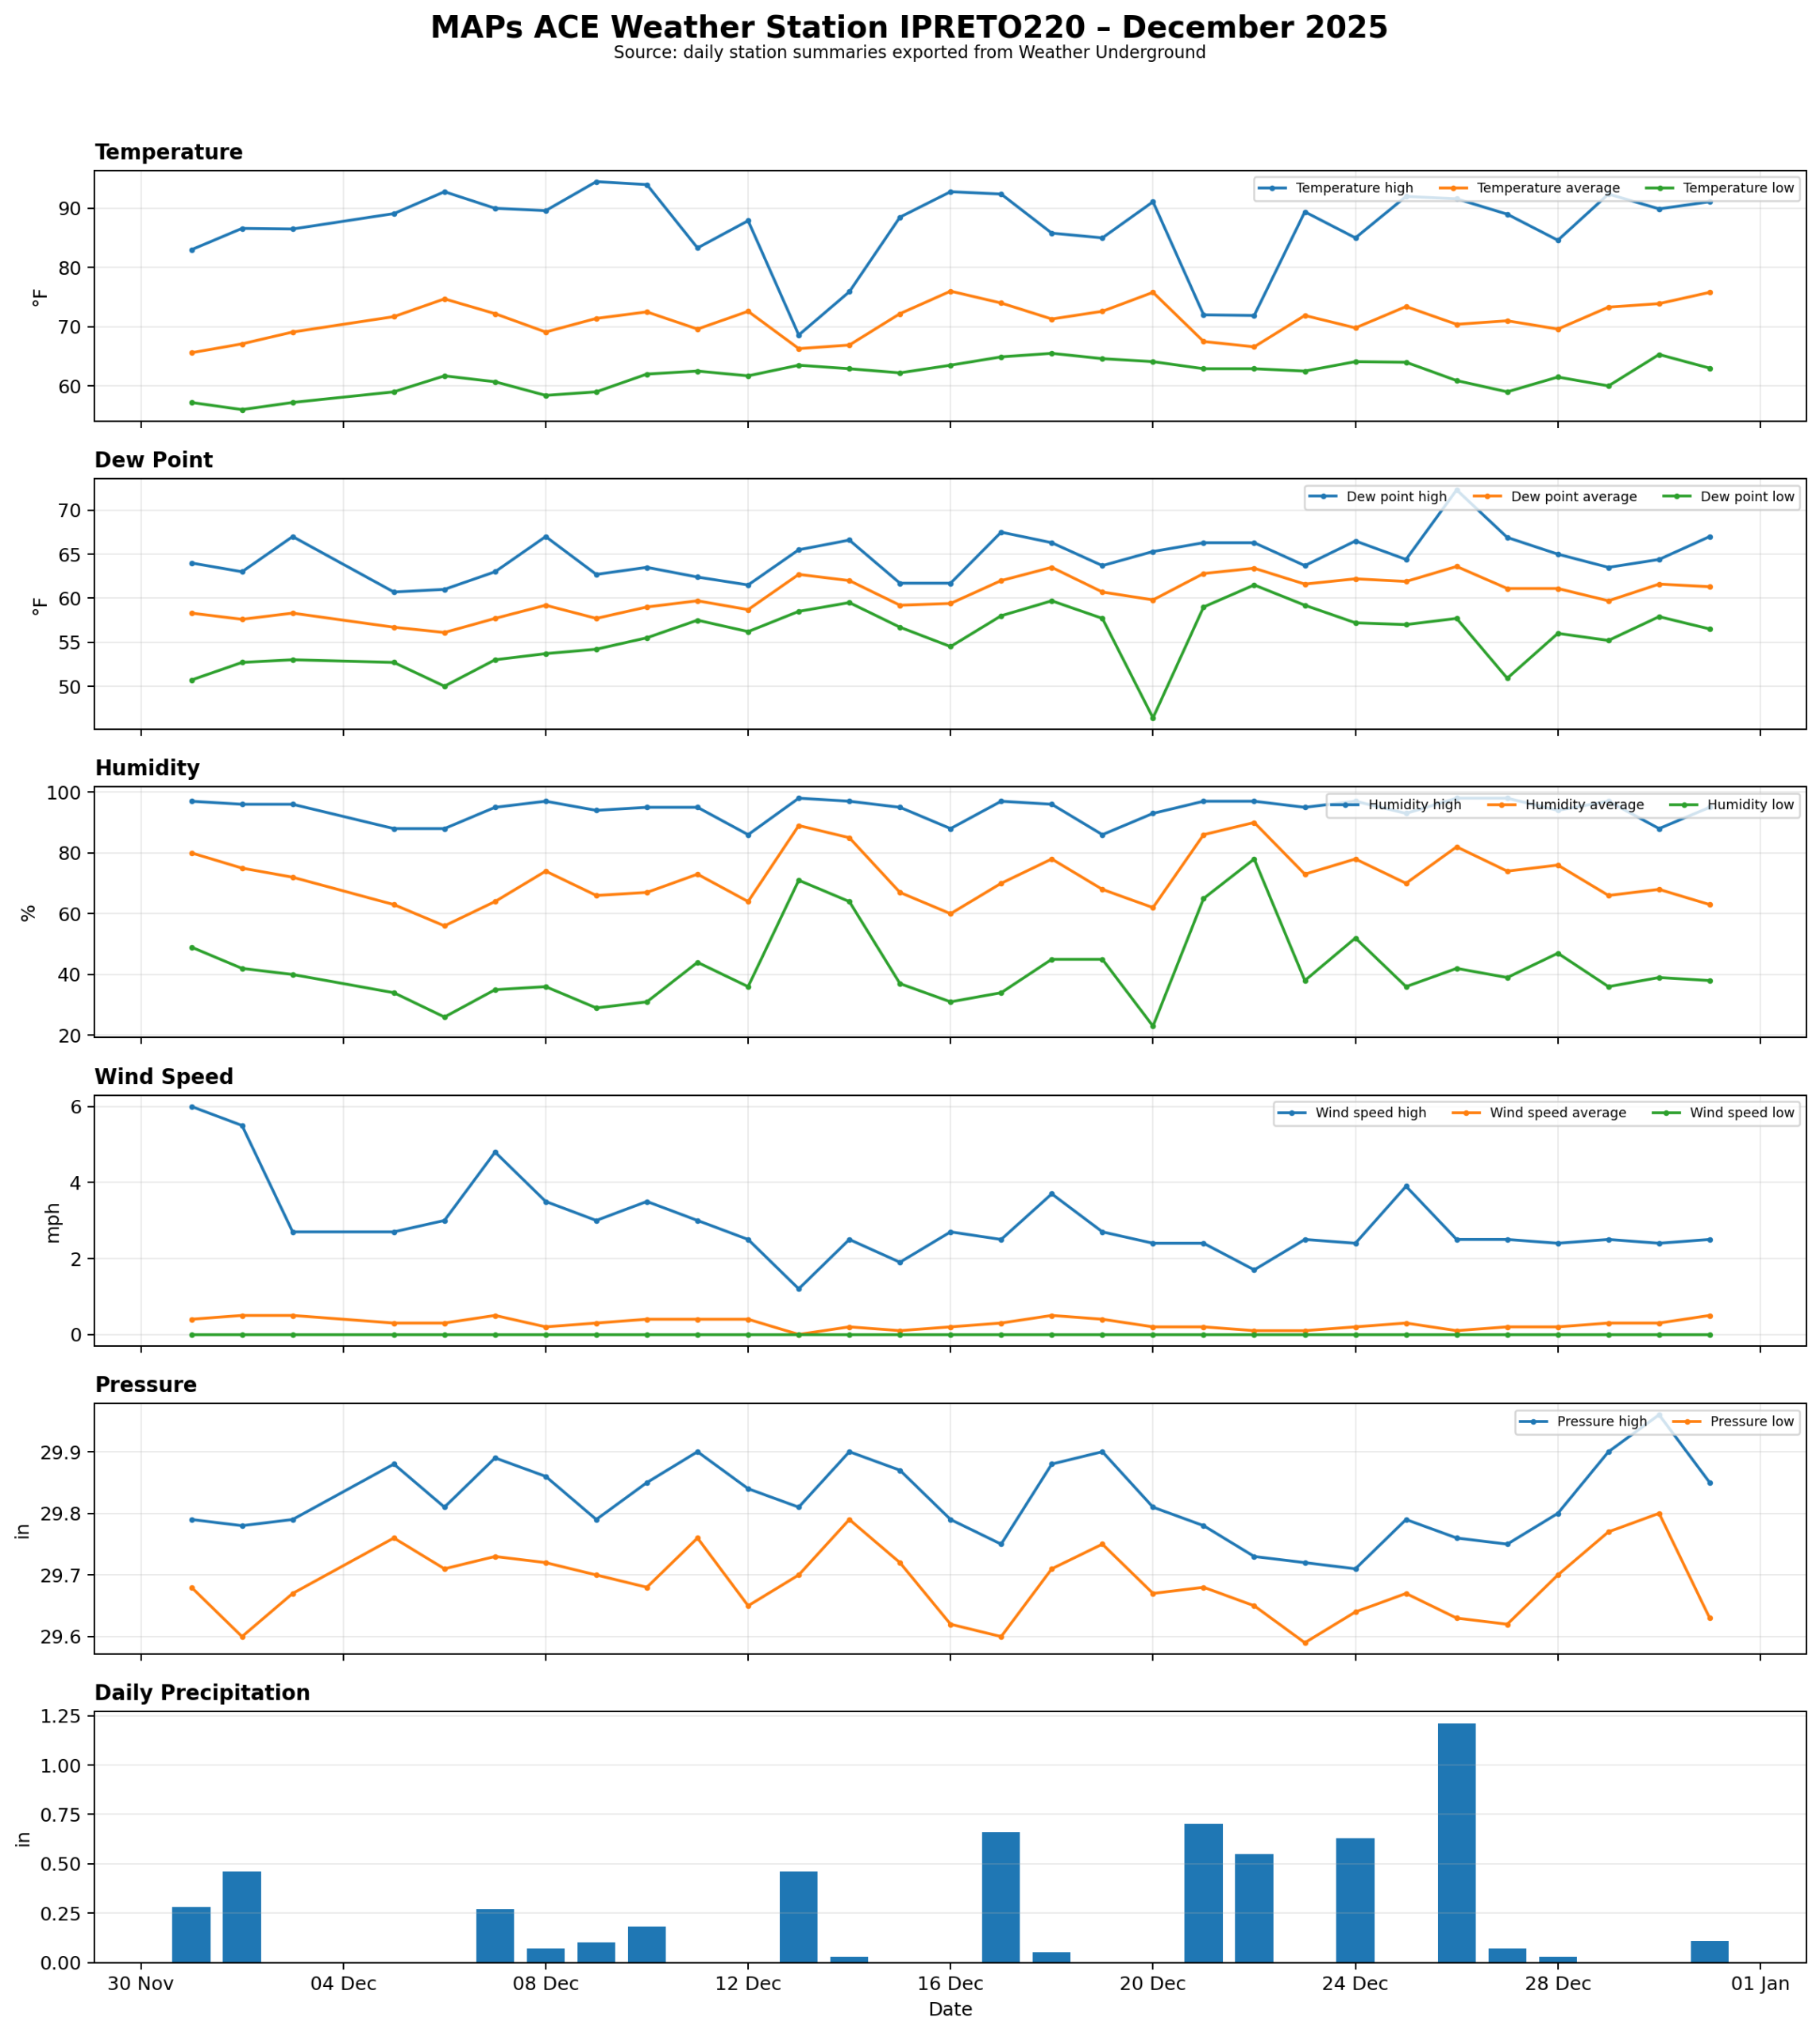 December 2025
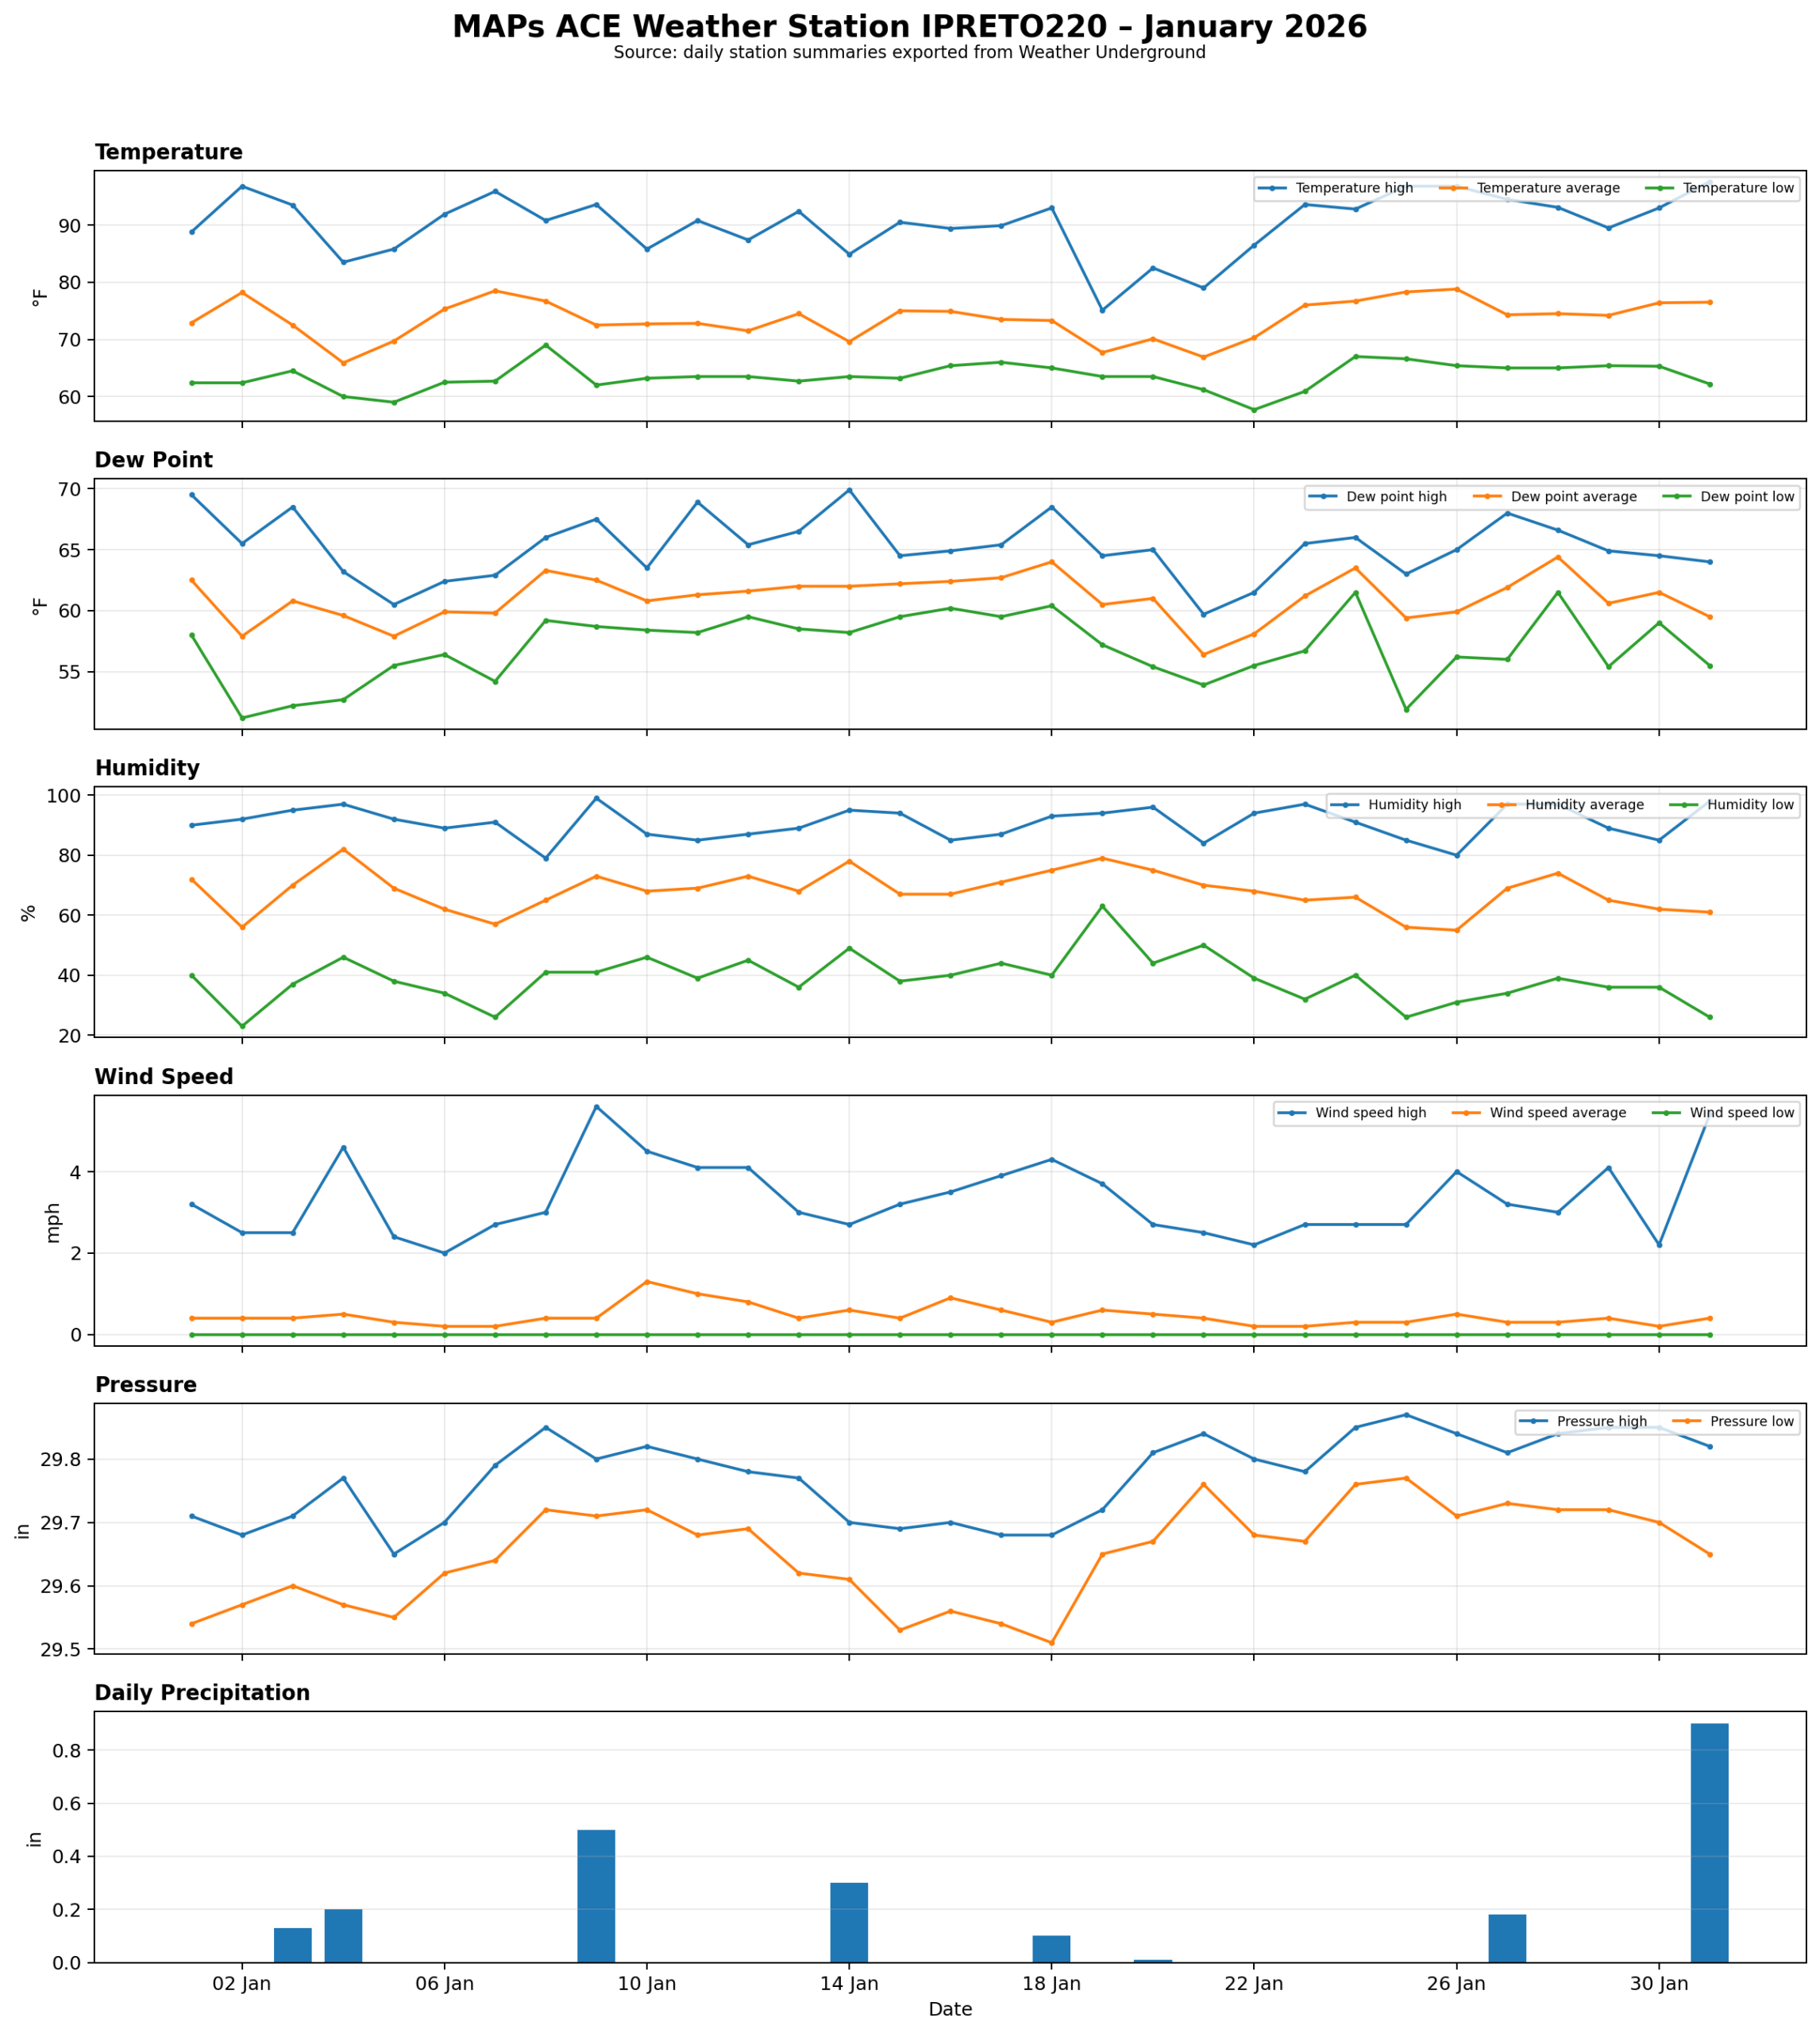 January 2026
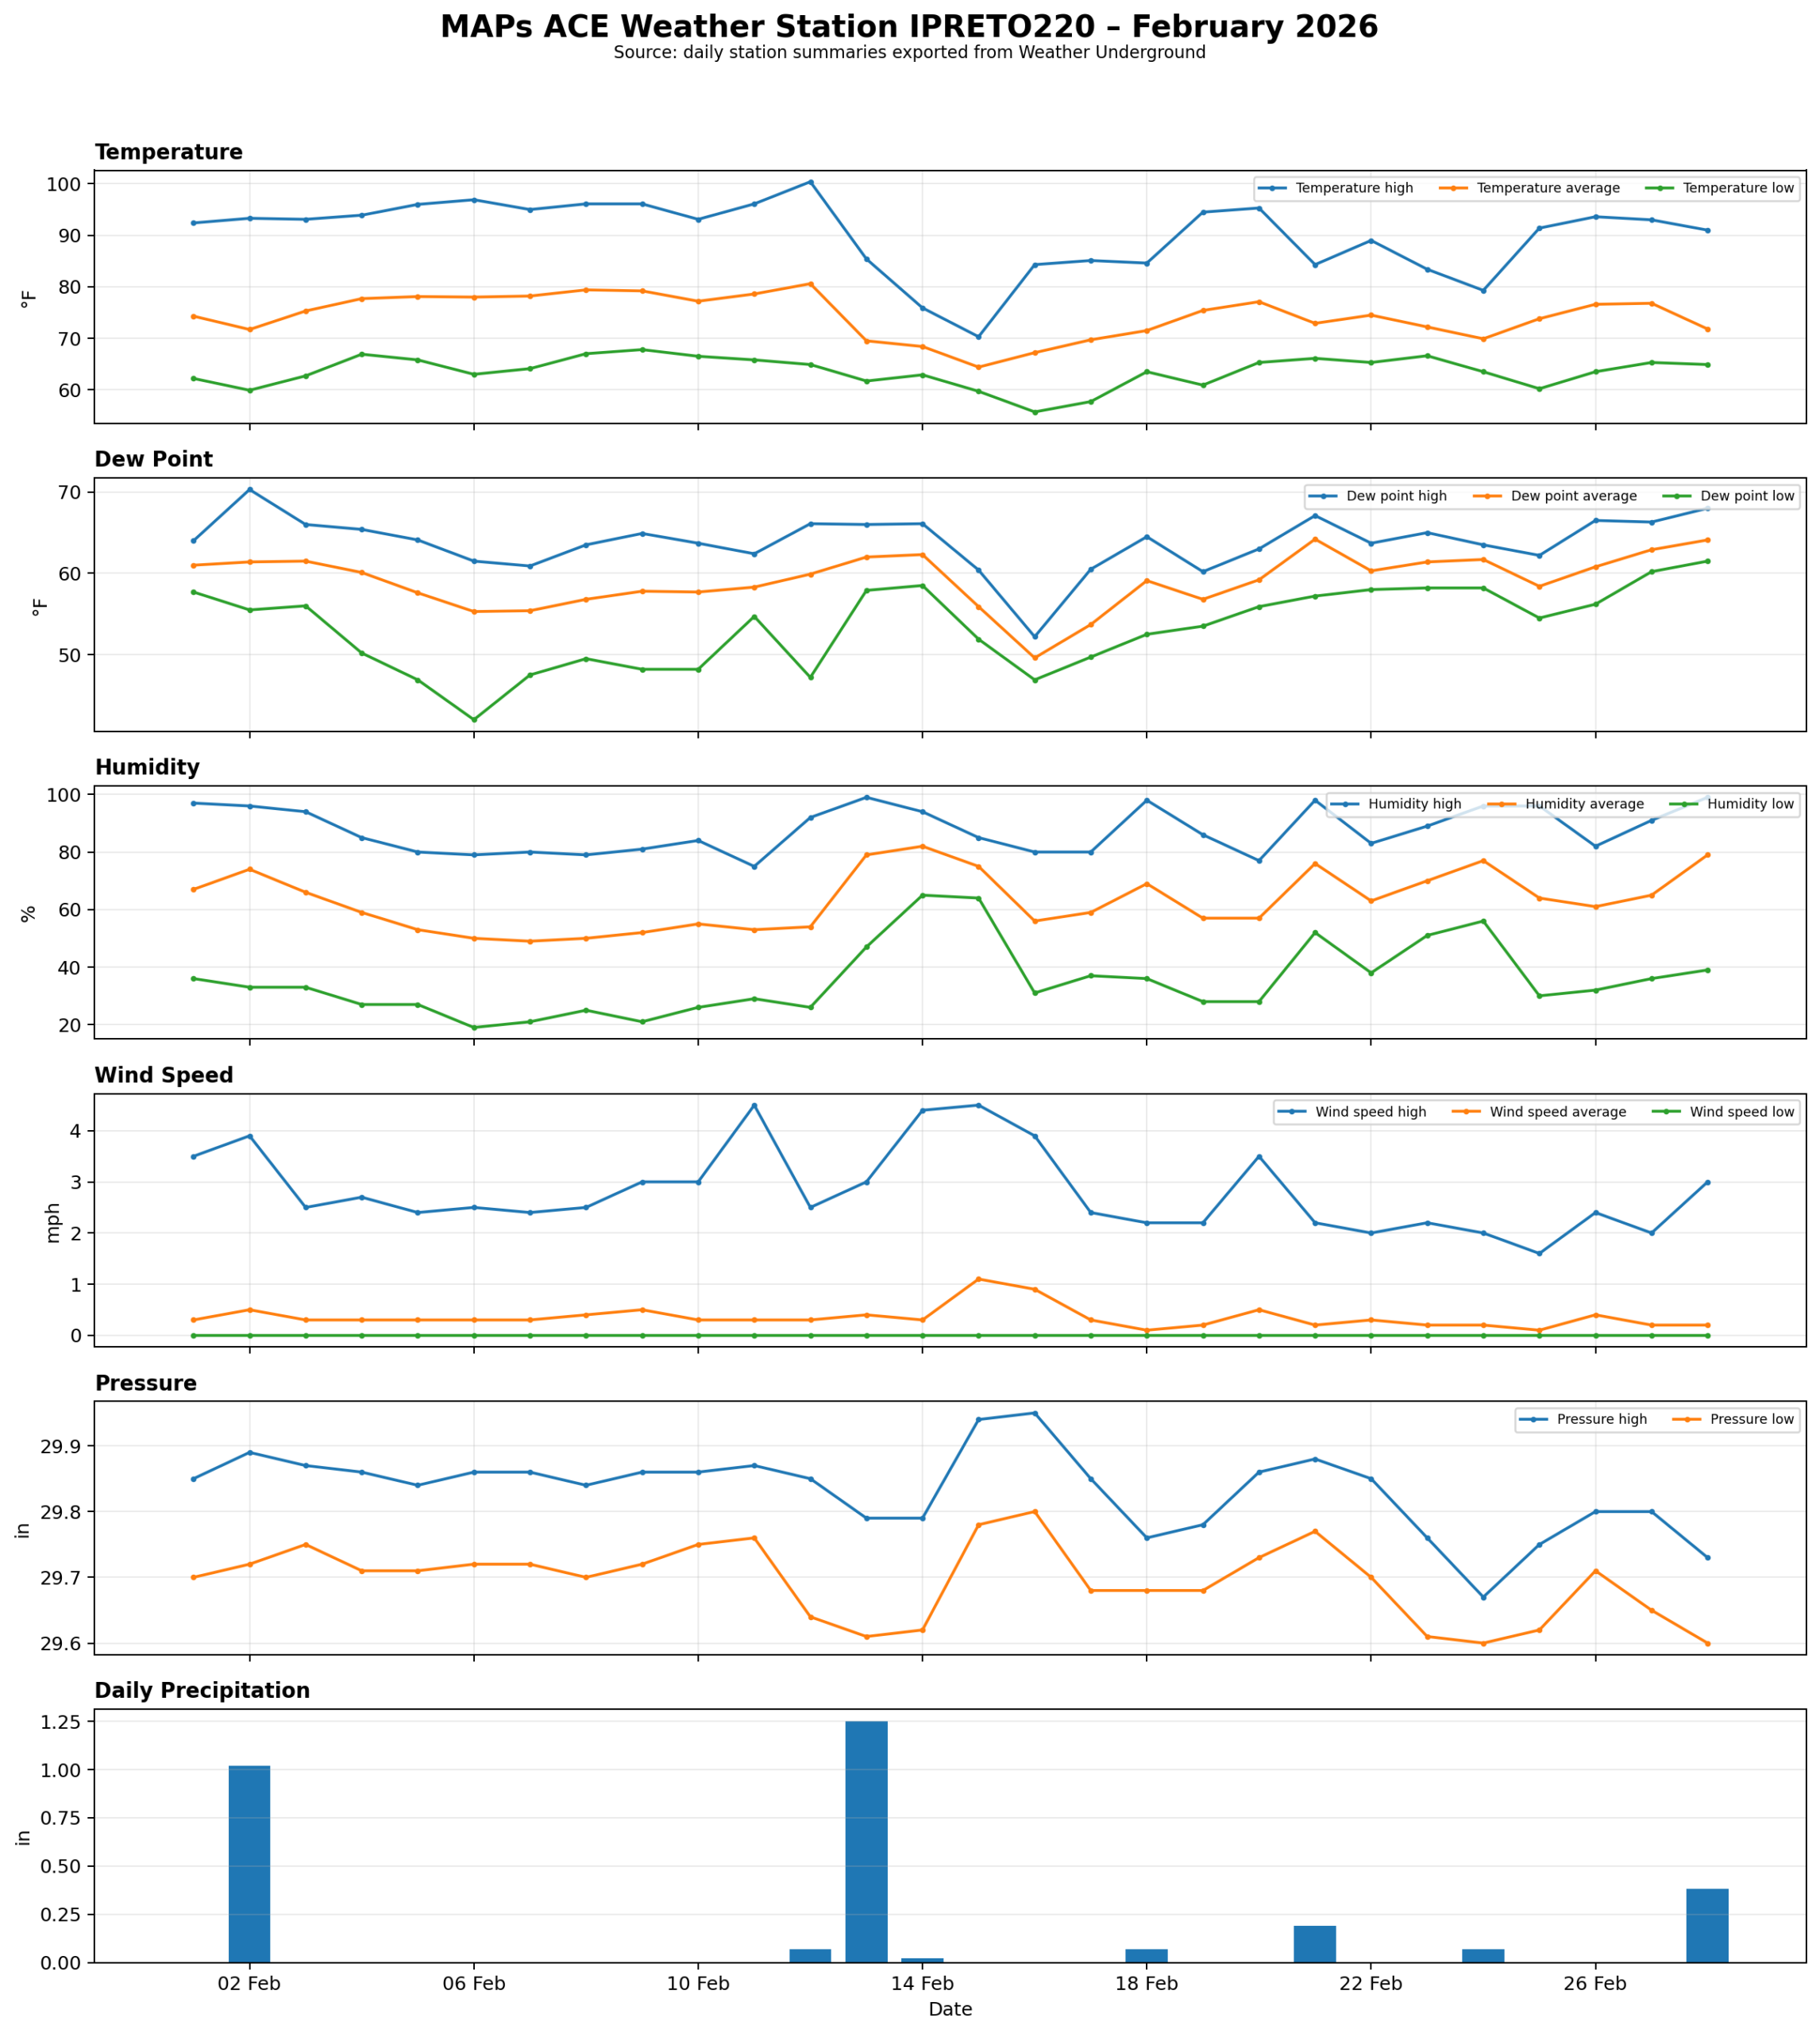 February 2026
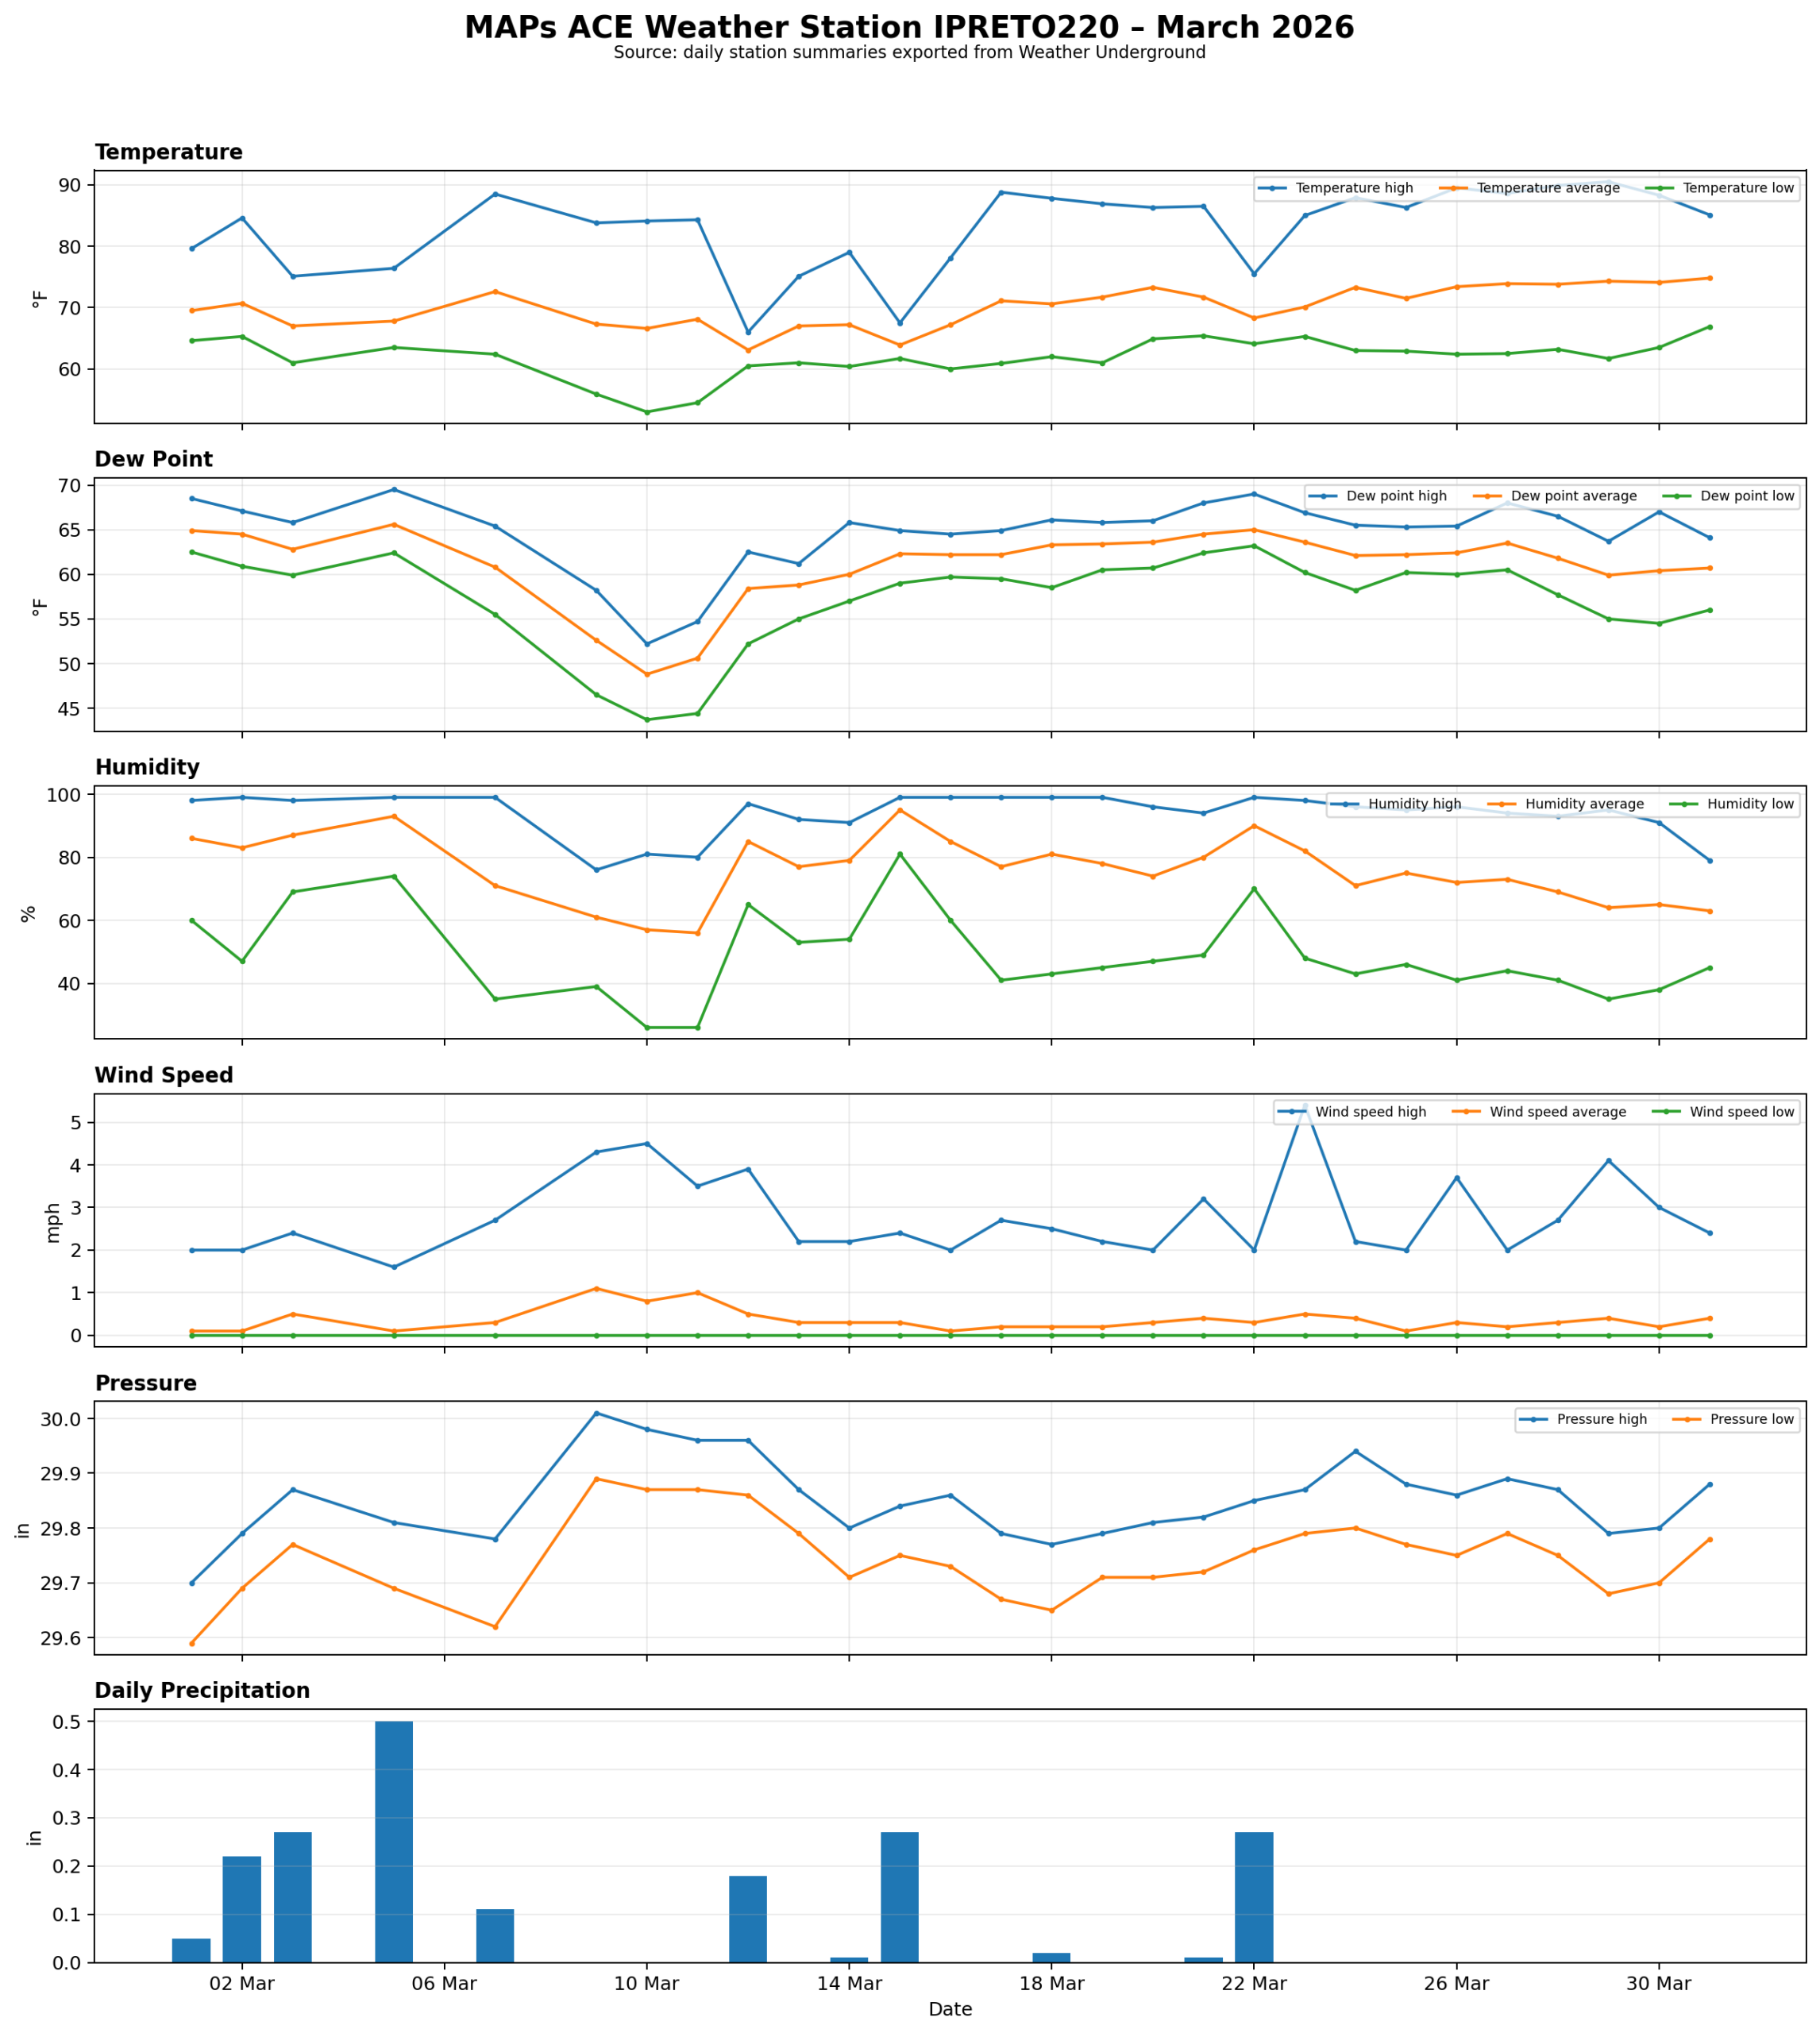 March 2026
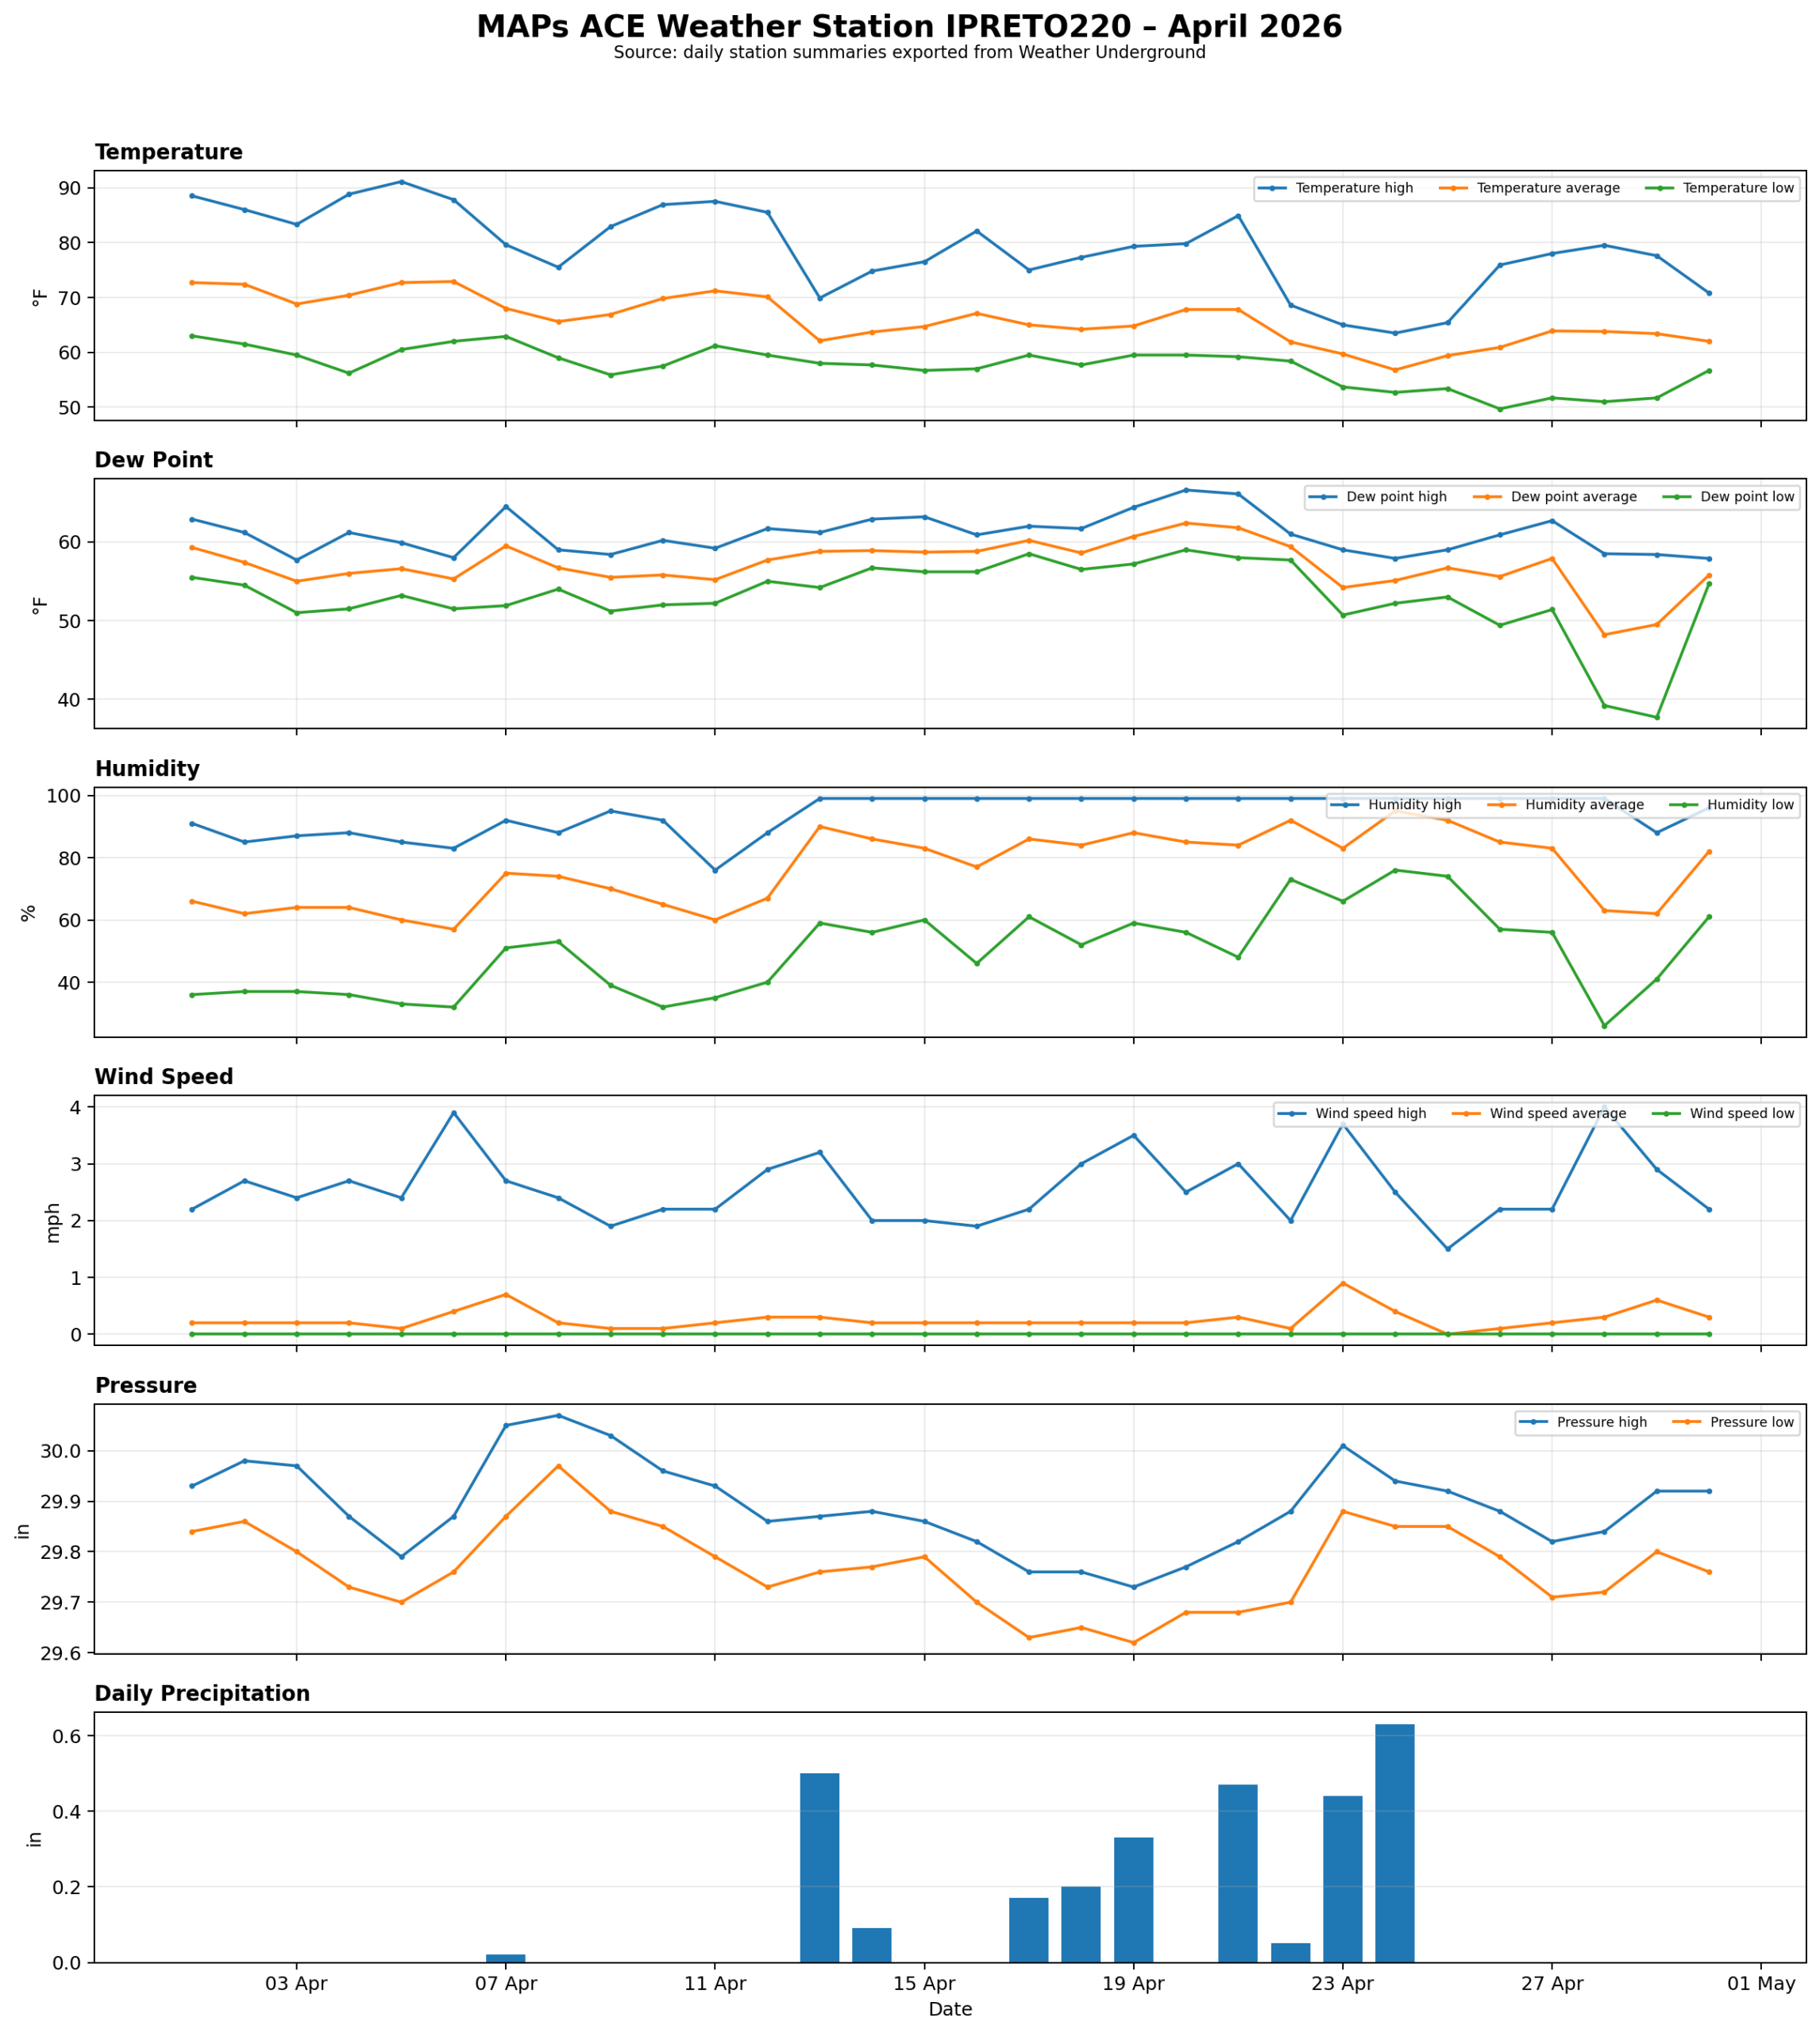 April 2026
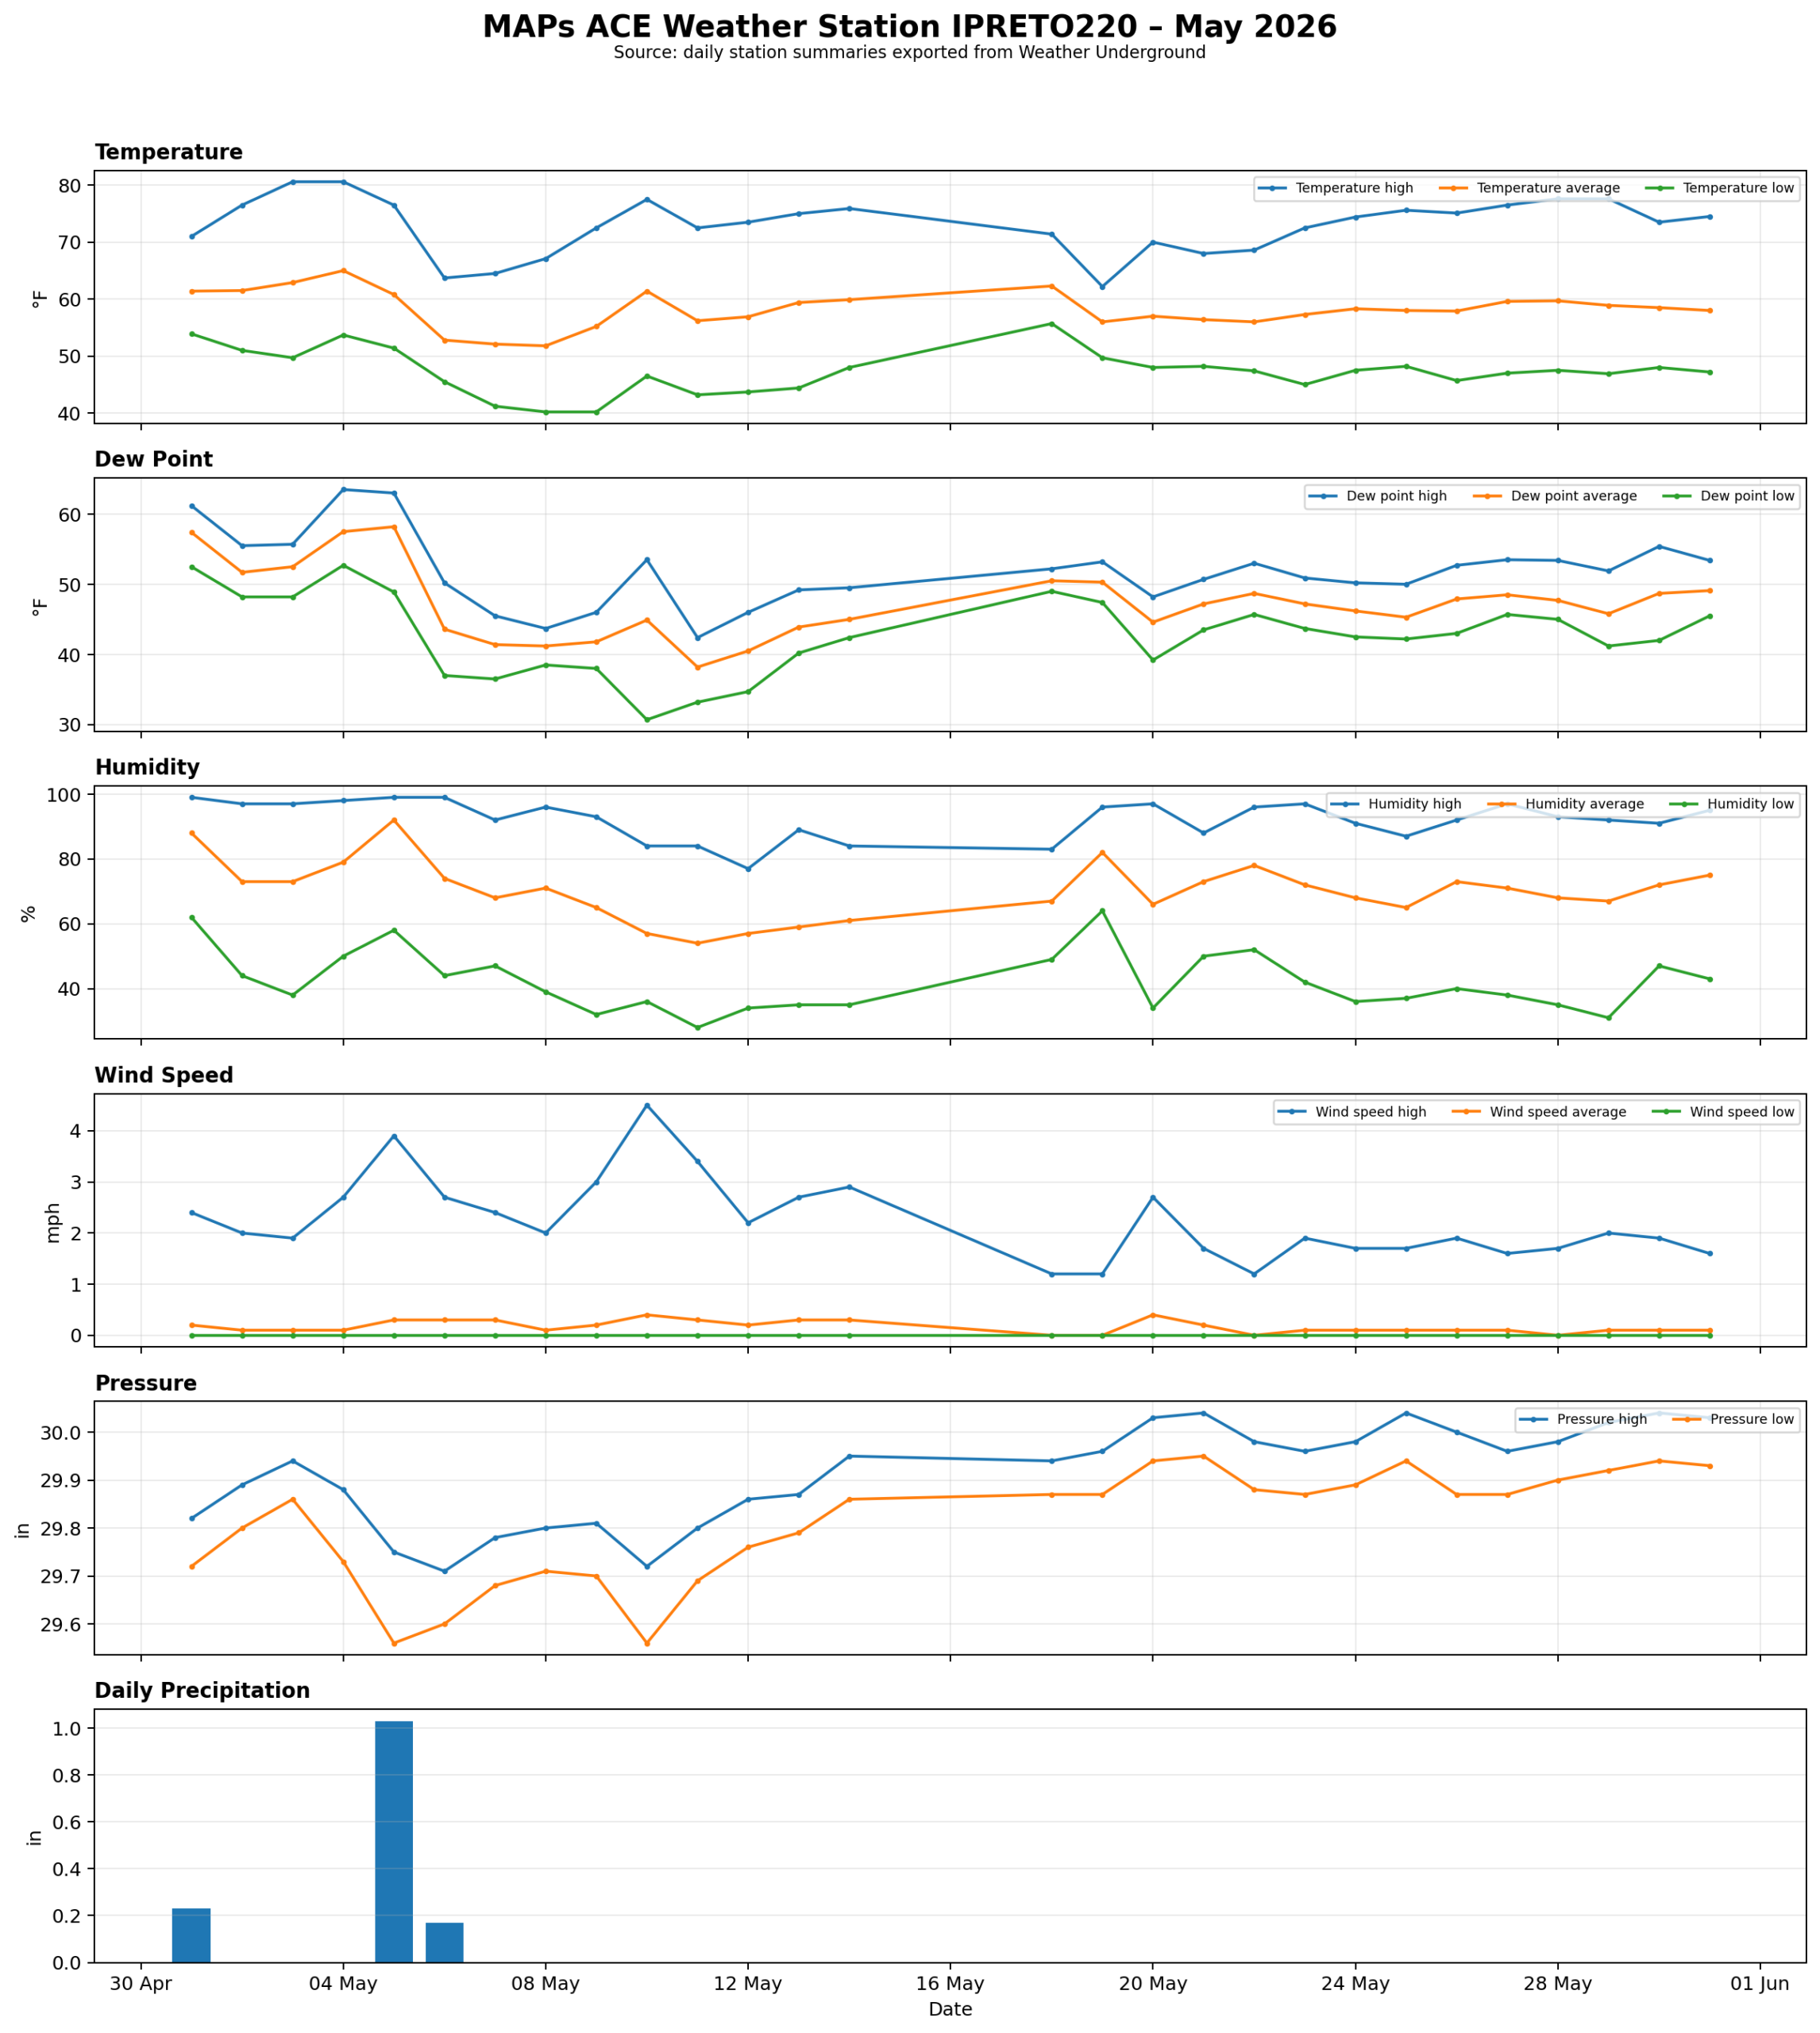 May 2026
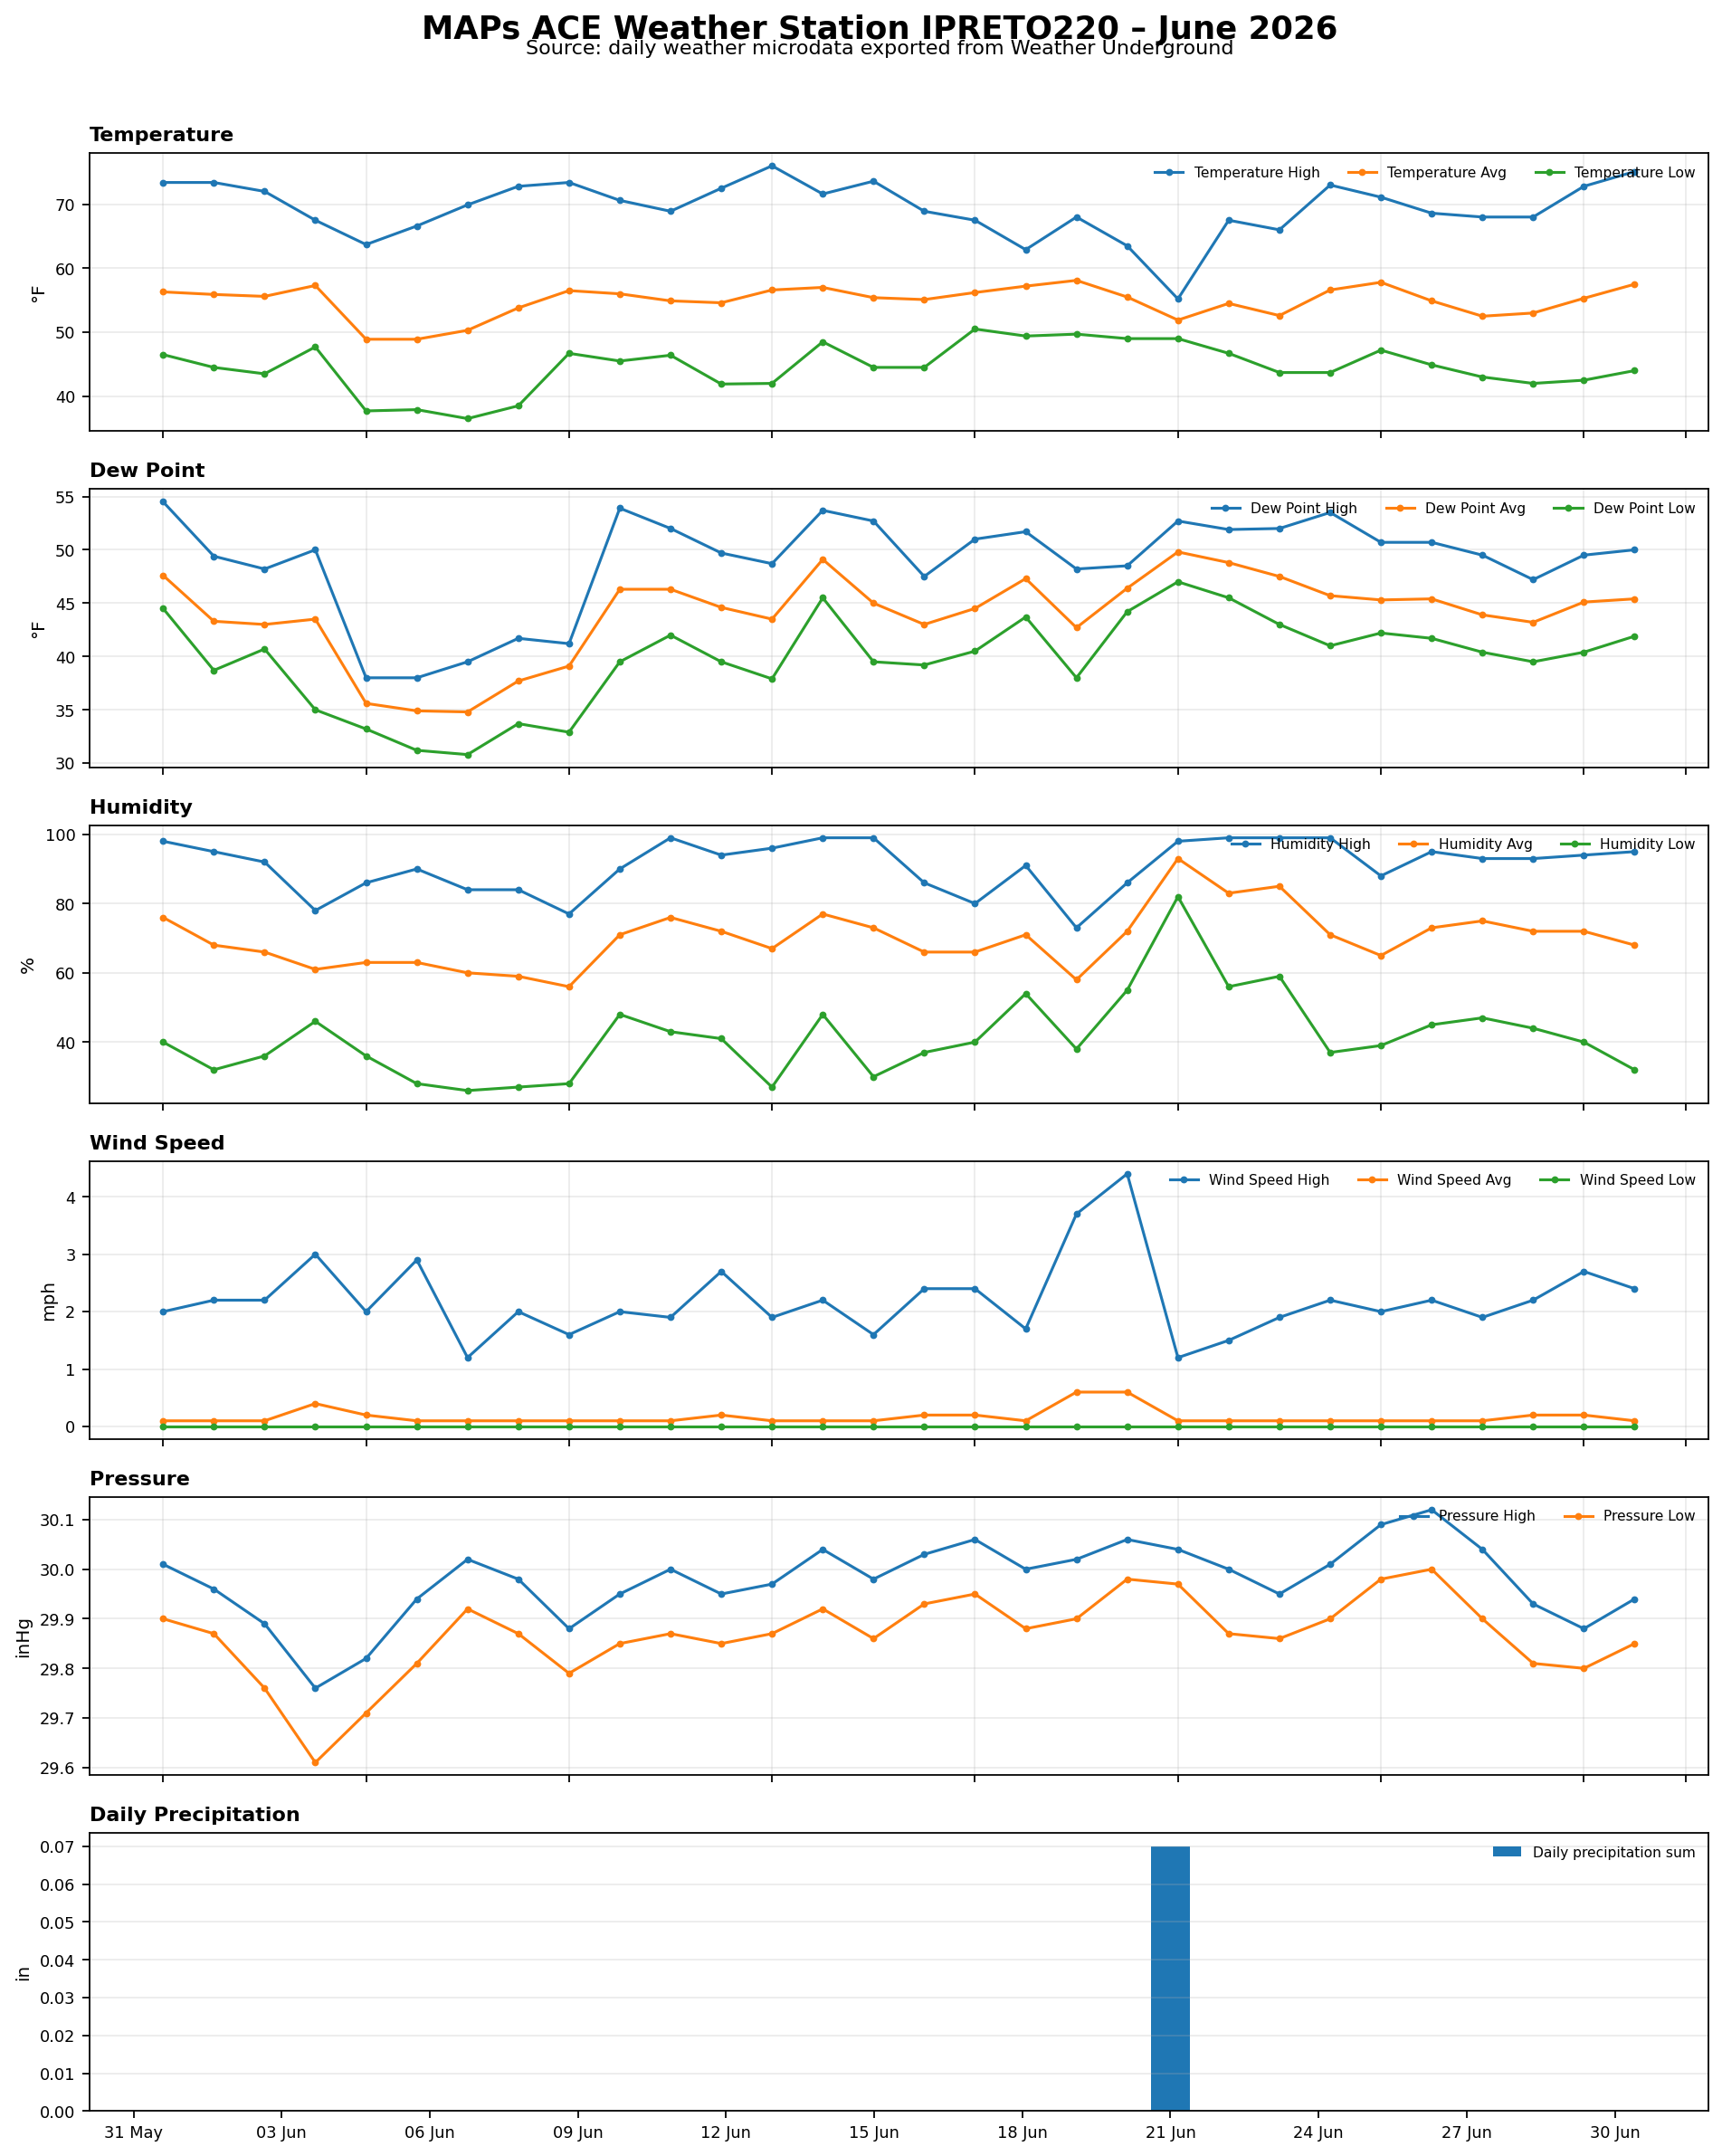 June 2026